LOOKING TO BE IN BY THE HOLIDAYS? OPEN FLOOR PLAN, VAULTED CEILINGS, ALL APPLIANCES, 2 CAR GARAGE, CUTE DECK! 2 BEDROOMS, DEN COULD BE USED AS 3RD BEDROOM. LAWN CARE/SNOW REMOVAL INCLUDED! CREDIT CHECK/BACKGROUND CHECK, FIRST MONTH RENT AND SECURITY DEPOSIT IS ALL YOU NEED TO MOVE IN! DON'T MISS THIS ONE, IT WON'T LAST LONG!
Foreclosed
Est. $250,206
3013 Covered Bridge Way, Joliet, IL 60435
2beds
2baths
1,723sqft
MultiFamily
Built in 2003
-- sqft lot
$-- Zestimate®
$145/sqft
$252/mo HOA
Overview
- 152 days
- 28
- 1
Facts & features
Interior
Bedrooms & bathrooms
- Bedrooms: 2
- Bathrooms: 2
Heating
- Forced air, Gas
Cooling
- Central
Appliances
- Included: Dishwasher, Dryer, Garbage disposal, Microwave, Range / Oven, Refrigerator, Washer
Features
- Flooring: Tile, Carpet
Interior area
- Total interior livable area: 1,723 sqft
Property
Parking
- Parking features: Garage - Attached
Features
- Exterior features: Vinyl
Details
- Parcel number: 0506011020691003
Construction
Type & style
- Home type: MultiFamily
Materials
- Frame
- Roof: Asphalt
Condition
- Year built: 2003
Community & HOA
HOA
- Has HOA: Yes
- HOA fee: $252 monthly
Location
- Region: Joliet
Financial & listing details
- Price per square foot: $145/sqft
- Tax assessed value: $250,206
- Annual tax amount: $6,620
Foreclosure details
Estimated market value
Not available
Estimated sales range
Not available
$2,094/mo
Price history
| Date | Event | Price |
|---|---|---|
| 3/14/2018 | Sold | $1,749,000+1245.4%$1,015/sqft |
Source: Public Record Report a problem | ||
| 12/9/2013 | Listing removed | $1,450$1/sqft |
Source: Prudential MAC Real Estate #08492680 Report a problem | ||
| 11/23/2013 | Listed for rent | $1,450$1/sqft |
Source: Prudential MAC Real Estate #08492680 Report a problem | ||
| 8/30/2013 | Listing removed | $130,000$75/sqft |
Source: CENTURY 21 Affiliated Pro-Team #08074361 Report a problem | ||
| 3/22/2013 | Pending sale | $130,000$75/sqft |
Source: CENTURY 21 Affiliated Pro-Team #08074361 Report a problem | ||
| 1/6/2013 | Price change | $130,000-7.1%$75/sqft |
Source: CENTURY 21 Pro-Team #08074361 Report a problem | ||
| 12/6/2012 | Price change | $140,000-3.4%$81/sqft |
Source: CENTURY 21 Pro-Team #08074361 Report a problem | ||
| 10/5/2012 | Price change | $145,000-3.3%$84/sqft |
Source: CENTURY 21 Pro-Team #08074361 Report a problem | ||
| 9/5/2012 | Price change | $150,000-7.4%$87/sqft |
Source: CENTURY 21 Pro-Team #08074361 Report a problem | ||
| 8/11/2012 | Price change | $162,000-7.4%$94/sqft |
Source: CENTURY 21 Pro-Team #08074361 Report a problem | ||
| 5/27/2012 | Listed for sale | $174,900-1.7%$102/sqft |
Source: CENTURY 21 Pro-Team #08074361 Report a problem | ||
| 9/29/2011 | Listing removed | $177,900$103/sqft |
Source: Coldwell Banker Honig-Bell #07764900 Report a problem | ||
| 4/1/2011 | Listed for sale | $177,900-5.4%$103/sqft |
Source: Coldwell Banker Honig-Bell #07764900 Report a problem | ||
| 5/23/2007 | Sold | $188,000+16%$109/sqft |
Source: Public Record Report a problem | ||
| 5/28/2003 | Sold | $162,000$94/sqft |
Source: Public Record Report a problem | ||
Public tax history
| Year | Property taxes | Tax assessment |
|---|---|---|
| 2024 | $6,620 +7.9% | $83,402 +11.3% |
| 2023 | $6,135 -3.2% | $74,934 +0.9% |
| 2022 | $6,339 +6.8% | $74,302 +6.3% |
| 2021 | $5,938 -0.1% | $69,899 |
| 2020 | $5,945 +3.2% | $69,899 +4.2% |
| 2019 | $5,763 -3.9% | $67,050 +8.8% |
| 2018 | $5,997 +8.6% | $61,650 +10.7% |
| 2017 | $5,524 +2.9% | $55,700 +6.7% |
| 2016 | $5,368 +6.2% | $52,200 +5.4% |
| 2015 | $5,054 | $49,518 +3.5% |
| 2014 | $5,054 +5% | $47,833 |
| 2013 | $4,816 -5.2% | $47,833 -10.2% |
| 2012 | $5,083 +24.2% | $53,286 -2.3% |
| 2011 | $4,093 -8% | $54,514 -10.5% |
| 2010 | $4,447 +1.4% | $60,890 -2.2% |
| 2009 | $4,384 +1.9% | $62,291 |
| 2008 | $4,301 | $62,291 +2.2% |
| 2007 | -- | $60,956 -7.5% |
| 2006 | $4,705 +36.3% | $65,904 +29.4% |
| 2005 | $3,452 -41.2% | $50,936 +1.4% |
| 2004 | $5,867 | $50,208 |
Find assessor info on the county website
Monthly payment
Climate risks
Neighborhood: 60435
- $295,9002 bd2 ba1.3k sqft3017 Covered Bridge Way, Joliet, IL 60435Off Market
- $297,800-- bd2 ba1.5k sqft3015 Covered Bridge Way, Joliet, IL 60435Off Market
- $292,0002 bd2 ba1.7k sqft3011 Covered Bridge Way, Joliet, IL 60435Off Market

- $220,0002 bd2 ba1.6k sqft3013 Covered Bridge Way UNIT 3013, Joliet, IL 60435Foreclosure

Similar homes
- $259,9003 bd2 ba1.7k sqft1617 Douglas St, Joliet, IL 60435Active
 MLS ID #12795965, Gaurav Kant, HomeSmart Connect LLC. MRED as distributed by MLS GRID
- $--3 bd2 ba1.6k sqft513 Cowles Ave, Joliet, IL 60435Auction
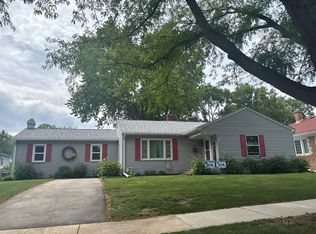 Auction.com 2
- $--3 bd2 ba1.5k sqft965 Shiloh Ct, Joliet, IL 60431Auction
 Auction.com 2
- $--3 bd1 ba1.2k sqft3132 Joann Dr, Joliet, IL 60431Auction
 Auction.com 2
