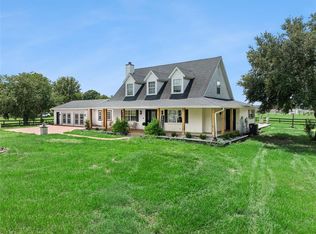
Great investment opportunity. Triplex with almost $4,000 a month in rental income. Sits on almost a half acre. Newer roof and AC units Call to schedule a showing.
For sale
$585,000
31 JUNIPER PASS DRIVE, OCALA, FL 34480
6beds
6baths
3,377sqft
Triplex, Multi Family
Built in 2003
-- sqft lot
$559,000 Zestimate®
$173/sqft
$-- HOA
What's special
Newer roof
- 10 days
- 119
- 5
Likely to sell faster than
Zillow last checked:
Listing updated:
Listed by:
Benjamin Larbus 419-231-0668,
THE EXPERTS TEAM REALTY INC 407-674-7994
Source: Stellar MLS,MLS#: O6455781 Originating MLS: Orlando Regional
Facts & features
Interior
Bedrooms & bathrooms
- Bedrooms: 6
- Bathrooms: 6
Heating
- Electric
Cooling
- Central Air
Appliances
- Laundry: Inside
Features
- Open Floorplan, Thermostat, Walk-In Closet(s)
- Has fireplace: No
Interior area
- Total interior livable area: 3,377 sqft
Property
Parking
- Total spaces: 1
- Parking features: Garage - Attached
- Attached garage spaces: 1
Features
- Exterior features: Garden, Lighting
Lot
- Size: 0.46 Acres
Details
- Parcel number: 9025062122
- Zoning: R3
- Special conditions: None
Construction
Type & style
- Home type: MultiFamily
- Property subtype: Triplex, Multi Family
Materials
- Concrete, Stucco
- Foundation: Slab
- Roof: Shingle
Condition
- New construction: No
- Year built: 2003
Utilities & green energy
- Sewer: Septic Tank
- Water: Private
- Utilities for property: Electricity Connected, Sewer Connected, Water Connected
Community & HOA
Community
- Pet fee: $0 monthly
- Subdivision: SILVER SPGS SHORES UN 25
HOA
- Has HOA: No
Location
- Region: Ocala
Financial & listing details
- Price per square foot: $173/sqft
- Tax assessed value: $364,905
- Annual tax amount: $6,675
- Date on market: 11/6/2026
- Cumulative days on market: 10 days
- Ownership: Fee Simple
- Total actual rent: 0
- Electric utility on property: Yes
- Road surface type: Asphalt
Estimated market value
$559,000
$531,000 - $587,000
$1,432/mo
Price history
| Date | Event | Price |
|---|---|---|
| 11/6/2026 | Listed for sale | $585,000+22.1%$173/sqft |
Source:  Stellar MLS #O6455781 Report a problem | ||
| 3/26/2025 | Listing removed | $479,000$142/sqft |
Source: Stellar MLS #O6281564 Report a problem | ||
| 3/21/2025 | Price change | $479,000-8.8%$142/sqft |
Source: Stellar MLS #O6281564 Report a problem | ||
| 2/20/2025 | Price change | $525,000+16.9%$155/sqft |
Source: Stellar MLS #O6281564 Report a problem | ||
| 2/17/2025 | Listed for sale | $449,000+99.6%$133/sqft |
Source: Stellar MLS #O6281564 Report a problem | ||
| 8/27/2019 | Sold | $225,000+32.4%$67/sqft |
Source: Stellar MLS #OM559534 Report a problem | ||
| 2/16/2005 | Sold | $170,000+3.5%$50/sqft |
Source: Public Record Report a problem | ||
| 3/28/2003 | Sold | $164,285+2638.1%$49/sqft |
Source: Public Record Report a problem | ||
| 1/16/2002 | Sold | $6,000$2/sqft |
Source: Public Record Report a problem | ||
Public tax history
| Year | Property taxes | Tax assessment |
|---|---|---|
| 2025 | $6,675 +14.7% | $310,812 +10% |
| 2024 | $5,817 +5.9% | $282,556 +10% |
| 2023 | $5,492 +15.4% | $256,869 +10% |
| 2022 | $4,759 +8.1% | $233,517 +10% |
| 2021 | $4,401 -0.6% | $212,288 |
| 2020 | $4,428 +34% | $212,288 +50.2% |
| 2019 | $3,303 | $141,372 +10% |
| 2018 | $3,303 +14.3% | $128,520 +4.3% |
| 2017 | $2,891 +11% | $123,165 +4.5% |
| 2016 | $2,603 | $117,810 +10% |
| 2015 | $2,603 +3.7% | $107,100 |
| 2014 | $2,511 +6% | $107,100 +7.7% |
| 2013 | $2,370 -4.5% | $99,450 -7.1% |
| 2012 | $2,481 -11.5% | $107,100 -16.1% |
| 2011 | $2,803 -10.3% | $127,602 -14.5% |
| 2010 | $3,126 -16.4% | $149,175 -23.5% |
| 2009 | $3,741 -16% | $195,075 -21.2% |
| 2008 | $4,452 -1.5% | $247,401 -2% |
| 2007 | $4,520 +3.6% | $252,450 +15.5% |
| 2006 | $4,363 +41% | $218,484 +43.6% |
| 2005 | $3,095 | $152,158 +8.7% |
| 2004 | $3,095 +1922.3% | $139,995 +2233.3% |
| 2002 | $153 +37.2% | $6,000 +20% |
| 2001 | $112 | $5,000 |
| 2000 | $112 | $5,000 |
Find assessor info on the county website
Monthly payment
Est. payment
Payment breakdown
Explore the cost of this home by adjusting the details. Changes won't be saved.Climate risks
Neighborhood: 34480


Similar homes
- $499,0006 bd4 ba3k sqft5160 SE 29TH STREET, OCALA, FL 34480For Sale

 MLS ID #OM727363, John Amerson, UNLOCK REALTY GROUP INC. Stellar MLS
- $489,9006 bd5 ba3.9k sqft4520 SE 30TH STREET, OCALA, FL 34480For Sale
 MLS ID #OM733751, Andrew McIntosh, COME HOME REALTY GROUP, LLC. Stellar MLS
- $682,5004 bd4 ba3.3k sqft160 JUNIPER TRAIL, OCALA, FL 34480For Sale
 MLS ID #O6430868, Sandra Rivera, LPT REALTY, LLC. Stellar MLS
- $399,0006 bd4 ba2.1k sqft1673 SW 107TH LANE, OCALA, FL 34476For Sale
 MLS ID #OM723169, Joshua Brown, CROSSROADS REALTY, INC. Stellar MLS
- $420,0004 bd4 ba2.4k sqft4580 SW 37TH LANE, OCALA, FL 34474For SaleMLS ID #O6455808, Benjamin Larbus, THE EXPERTS TEAM REALTY INC. Stellar MLS
- $399,9996 bd4 ba2.1k sqft1658 SW 108TH LANE, OCALA, FL 34476For SaleMLS ID #W7889250, Jarrod Cruz, TROPIC SHORES REALTY LLC. Stellar MLS
- $399,9003 bd2 ba1.8k sqft3974 SE 24TH COURT, OCALA, FL 34480For SaleMLS ID #OM733298, Desiree Barbazon, DESIREE BARBAZON REALTY. Stellar MLS
- $375,0005 bd3 ba2.1k sqft110 PECAN PASS, OCALA, FL 34472For SaleMLS ID #OM733011, Tim Castaneda, LOKATION. Stellar MLS
- $325,0003 bd2 ba2.1k sqft5075 NE 7TH PLACE, OCALA, FL 34470For SaleMLS ID #TB8566591, Bridd Bone, KELLER WILLIAMS SUBURBAN TAMPA. Stellar MLS
- $649,9004 bd3 ba2.9k sqft1701 SE 28TH STREET, OCALA, FL 34471For SaleMLS ID #OM712523, Michael Owen, GREATER OCALA PROPERTIES, INC. Stellar MLS
- $300,0004 bd2 ba2.2k sqft5277 SE 91ST PLACE, OCALA, FL 34480For SaleMLS ID #G5114240, Damon Morton, DOWN HOME REALTY, LLLP. Stellar MLS
- $550,0003 bd2 ba2.3k sqft1989 NW 111TH LOOP, OCALA, FL 34475For SaleMLS ID #OM725303, Lisa Toler, R N B REALTY. Stellar MLS
- $295,0004 bd2 ba1.8k sqft414 NE 9TH AVENUE, OCALA, FL 34470For SaleMLS ID #OM734683, Jina Humphries, SELLSTATE NEXT GENERATION REALTY. Stellar MLS
- $409,0006 bd4 ba2.6k sqft51 NW 21ST PLACE, OCALA, FL 34475For SaleMLS ID #OM732134, Dawn Padot, DALTON WADE INC. Stellar MLS
- $599,9004 bd3 ba2k sqft12920 SW 73RD STREET, OCALA, FL 34481New ConstructionMLS ID #OM734306, Solveig Cumston, REAL BROKER, LLC. Stellar MLS
- $389,9004 bd2 ba2k sqft23 PINE COURSE RUN, OCALA, FL 34472New ConstructionMLS ID #OM734363, William Stiles, LOKATION. Stellar MLS
- $545,0004 bd2 ba2.2k sqft2576 SW 175TH LOOP, OCALA, FL 34473For SaleMLS ID #O6369777, Crystal Persaud, CENTURY 21 CARIOTI. Stellar MLS
- $302,9004 bd2 ba1.8k sqft54 JUNIPER TRAIL LOOP, OCALA, FL 34480New ConstructionMLS ID #OM718715, Sandy McDermott, SANDRA MCDERMOTT REAL ESTATE. Stellar MLS
