This 2499 square foot single family home has 5 bedrooms and 2.0 bathrooms. This home is located at 3104 Missouri Ave, Las Cruces, NM 88011.
Pre-foreclosure
Street View
Est. $288,900
3104 Missouri Ave, Las Cruces, NM 88011
5beds
2,499sqft
SingleFamily
Built in 1975
0.25 Acres Lot
$288,900 Zestimate®
$116/sqft
$-- HOA
Overview
- 53 days
- 37
- 2
Facts & features
Interior
Bedrooms & bathrooms
- Bedrooms: 5
- Bathrooms: 2
- Full bathrooms: 2
Heating
- Forced air, Gas
Cooling
- Refrigerator, Central
Interior area
- Total interior livable area: 2,499 sqft
Property
Parking
- Total spaces: 4
- Parking features: Garage - Attached
Features
- Exterior features: Brick, Cement / Concrete
Lot
- Size: 0.25 Acres
Details
- Parcel number: 4010135083429
Construction
Type & style
- Home type: SingleFamily
Materials
- Roof: Asphalt
Condition
- Year built: 1975
Community & HOA
Location
- Region: Las Cruces
Financial & listing details
- Price per square foot: $116/sqft
- Tax assessed value: $330,643
- Annual tax amount: $3,338
Foreclosure details
Estimated market value
$288,900
$274,000 - $303,000
$2,639/mo
Price history
| Date | Event | Price |
|---|---|---|
| 8/28/2026 | Listing removed | $295,000$118/sqft |
Source: SNMMLS as distributed by MLS GRID #2601388 Report a problem | ||
| 7/26/2026 | Listed for sale | $295,000$118/sqft |
Source: SNMMLS as distributed by MLS GRID #2601388 Report a problem | ||
| 6/24/2026 | Pending sale | $295,000$118/sqft |
Source: SNMMLS as distributed by MLS GRID #2601388 Report a problem | ||
| 5/1/2026 | Listed for sale | $295,000-0.8%$118/sqft |
Source: SNMMLS as distributed by MLS GRID #2601388 Report a problem | ||
| 2/1/2026 | Listing removed | $297,500$119/sqft |
Source: SNMMLS as distributed by MLS GRID #2501009 Report a problem | ||
| 11/7/2025 | Price change | $297,500-2.4%$119/sqft |
Source: SNMMLS as distributed by MLS GRID #2501009 Report a problem | ||
| 10/14/2025 | Price change | $304,950-3.2%$122/sqft |
Source: SNMMLS as distributed by MLS GRID #2501009 Report a problem | ||
| 9/25/2025 | Price change | $315,000-3%$126/sqft |
Source: SNMMLS as distributed by MLS GRID #2501009 Report a problem | ||
| 8/11/2025 | Price change | $324,900-1.2%$130/sqft |
Source: SNMMLS as distributed by MLS GRID #2501009 Report a problem | ||
| 7/11/2025 | Price change | $329,000-2.9%$132/sqft |
Source: SNMMLS as distributed by MLS GRID #2501009 Report a problem | ||
| 4/16/2025 | Listed for sale | $339,000+5.9%$136/sqft |
Source: SNMMLS as distributed by MLS GRID #2501009 Report a problem | ||
| 1/24/2024 | Sold | -- |
Source: Agent Provided Report a problem | ||
| 11/21/2023 | Pending sale | $320,000$128/sqft |
Source: SNMMLS as distributed by MLS GRID #2302868 Report a problem | ||
| 11/3/2023 | Listed for sale | $320,000+10.4%$128/sqft |
Source: SNMMLS as distributed by MLS GRID #2302868 Report a problem | ||
| 2/8/2022 | Pending sale | $289,900$116/sqft |
Source: SNMMLS as distributed by MLS GRID #2103799 Report a problem | ||
| 12/23/2021 | Listed for sale | $289,900+18.4%$116/sqft |
Source: SNMMLS as distributed by MLS GRID #2103799 Report a problem | ||
| 9/19/2021 | Listing removed | -- |
Source: SNMMLS as distributed by MLS GRID #2102610 Report a problem | ||
| 8/15/2021 | Price change | $244,900+8.9%$98/sqft |
Source: SNMMLS as distributed by MLS GRID #2102610 Report a problem | ||
| 8/14/2021 | Listed for sale | $224,900$90/sqft |
Source: SNMMLS as distributed by MLS GRID #2102610 Report a problem | ||
| 10/2/2000 | Sold | -- |
Source: Public Record Report a problem | ||
Public tax history
| Year | Property taxes | Tax assessment |
|---|---|---|
| 2025 | $3,338 +3.1% | $110,214 +3.7% |
| 2024 | $3,236 -1.5% | $106,254 |
| 2023 | $3,286 +73.5% | $106,254 +76% |
| 2022 | $1,894 +7% | $60,383 +3% |
| 2021 | $1,770 +2.6% | $58,625 +3% |
| 2020 | $1,726 +2.8% | $56,918 +3% |
| 2019 | $1,678 +3.8% | $55,260 +3% |
| 2018 | $1,617 | $53,651 +3% |
| 2017 | $1,617 +12.3% | $52,089 +3% |
| 2016 | $1,440 +1.8% | $50,571 -65.7% |
| 2015 | $1,415 +2.6% | $147,296 +3% |
| 2014 | $1,379 +11.5% | $143,006 +3% |
| 2013 | $1,237 +0% | $138,841 +3% |
| 2012 | $1,236 +4.7% | $134,797 +3% |
| 2011 | $1,181 +5.1% | $130,871 +3% |
| 2010 | $1,125 +9.9% | $127,058 +3% |
| 2009 | $1,023 | $123,357 +3% |
| 2008 | $1,023 +3.9% | $119,764 +3% |
| 2007 | $985 +4.4% | $116,276 +3% |
| 2005 | $944 +4.5% | $112,890 +6.1% |
| 2004 | $903 -2.5% | $106,400 |
| 2003 | $926 -2.6% | $106,400 -2.9% |
| 2002 | $951 | $109,600 |
| 2001 | $951 +3.9% | $109,600 +3.1% |
| 2000 | $915 | $106,300 |
Find assessor info on the county website
Monthly payment
Climate risks
Neighborhood: 88011


Similar homes
- $320,0004 bd4 ba2.7k sqft1766 Imperial Rdg, Las Cruces, NM 88011For Sale
 MLS ID #20263313, Steve Montanez. New Mexico MLS
- $298,0003 bd2 ba2.1k sqft1714 Royal Dr, Las Cruces, NM 88011For Sale
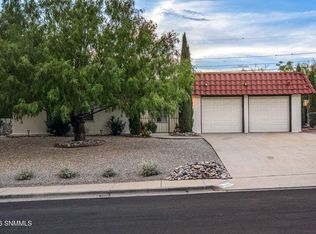 MLS ID #2602677, Quayde A Bradford, Keller Williams Realty. SNMMLS as distributed by MLS GRID
- $299,0003 bd2 ba1.8k sqft3116 High St, Las Cruces, NM 88011For Sale
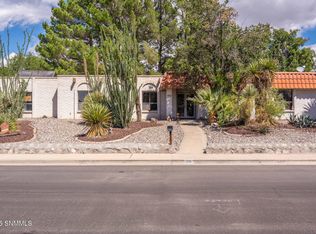 MLS ID #2603157, Michael D Carvlin, BHGRE Steinborn & Associates. SNMMLS as distributed by MLS GRID
- $349,5004 bd2 ba2.6k sqft1716 Pomona Dr, Las Cruces, NM 88011For Sale
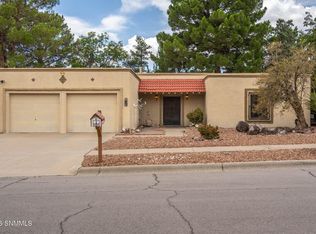 MLS ID #2602647, Ron Bruder, BHGRE Steinborn & Associates. SNMMLS as distributed by MLS GRID
