Sweat equity !!! A rare find in todays market. Solid bones on this ALL BRICK home. Good income property to build upon.
For sale
$69,900
3115 Garland St, Lansing, MI 48906
3beds
1,000sqft
Single Family Residence
Built in 1940
0.26 Acres Lot
$-- Zestimate®
$70/sqft
$-- HOA
What's special
- 29 days
- 1,546
- 85
Likely to sell faster than
Zillow last checked:
Listing updated:
Listed by:
John DesJardins 734-250-1500,
Downriver Property Experts LLC 734-250-1500
Source: Realcomp II,MLS#: 20261081925
Facts & features
Interior
Bedrooms & bathrooms
- Bedrooms: 3
- Bathrooms: 1
- Full bathrooms: 1
Primary bedroom
- Level: Entry
- Area: 110
- Dimensions: 11 X 10
Bedroom
- Level: Second
- Area: 110
- Dimensions: 11 X 10
Bedroom
- Level: Second
- Area: 99
- Dimensions: 11 X 9
Other
- Level: Entry
- Area: 35
- Dimensions: 7 X 5
Kitchen
- Level: Entry
- Area: 108
- Dimensions: 12 X 9
Living room
- Level: Entry
- Area: 117
- Dimensions: 13 X 9
Heating
- Forced Air, Natural Gas
Features
- Basement: Unfinished
- Has fireplace: No
Interior area
- Total interior livable area: 1,000 sqft
- Finished area above ground: 1,000
Property
Parking
- Total spaces: 2
- Parking features: Two Car Garage, Detached
- Garage spaces: 2
Features
- Levels: One And One Half
- Stories: 1.5
- Entry location: GroundLevel
- Pool features: None
Lot
- Size: 0.26 Acres
- Dimensions: 66 x 172
Details
- Parcel number: 010103151131
- Special conditions: Short Sale No,Standard
Construction
Type & style
- Home type: SingleFamily
- Architectural style: Bungalow
- Property subtype: Single Family Residence
Materials
- Brick
- Foundation: Basement, Block
Condition
- New construction: No
- Year built: 1940
Utilities & green energy
- Sewer: Public Sewer
- Water: Public
Community & HOA
Community
- Subdivision: EAST STREET
HOA
- Has HOA: No
Location
- Region: Lansing
Financial & listing details
- Price per square foot: $70/sqft
- Tax assessed value: $38,302
- Annual tax amount: $3,142
- Date on market: 10/9/2026
- Cumulative days on market: 29 days
- Listing agreement: Exclusive Right To Sell
- Listing terms: Cash
Estimated market value
Not available
Estimated sales range
Not available
$1,485/mo
Price history
| Date | Event | Price |
|---|---|---|
| 10/9/2026 | Listed for sale | $69,900$70/sqft |
Source:  Realcomp II #20261081925 Report a problem | ||
Public tax history
| Year | Property taxes | Tax assessment |
|---|---|---|
| 2025 | $3,021 +6.3% | $52,400 +5.2% |
| 2024 | $2,843 | $49,800 +9.2% |
| 2023 | -- | $45,600 +12.9% |
| 2022 | -- | $40,400 +10.1% |
| 2021 | -- | $36,700 +7% |
| 2020 | -- | $34,300 +11% |
| 2019 | $2,241 | $30,900 -0.6% |
| 2018 | $2,241 +37.1% | $31,100 |
| 2017 | $1,634 | $31,100 +1.6% |
| 2016 | $1,634 | $30,600 +3.4% |
| 2015 | $1,634 | $29,600 +3.5% |
| 2014 | $1,634 | $28,600 -0.3% |
| 2013 | -- | $28,700 -6.2% |
| 2012 | -- | $30,600 -8.1% |
| 2011 | -- | $33,300 -12.1% |
| 2010 | -- | $37,900 -8.9% |
| 2009 | -- | $41,600 -8.2% |
| 2008 | -- | $45,300 +1.3% |
| 2007 | -- | $44,700 +14.6% |
| 2006 | -- | $39,000 +3.7% |
| 2005 | -- | $37,600 +5.9% |
| 2004 | -- | $35,500 -1.4% |
| 2003 | -- | $36,000 +10.4% |
| 2002 | -- | $32,600 +11.6% |
| 2001 | -- | $29,200 +7.4% |
| 2000 | -- | $27,200 |
Find assessor info on the county website
Monthly payment
Est. payment
Payment breakdown
Explore the cost of this home by adjusting the details. Changes won't be saved.Climate risks
Neighborhood: 48906


Similar homes
- $69,0004 bd1 ba1.1k sqft1520 E Oakland Ave, Lansing, MI 48906For Sale

 MLS ID #20261084556, Simon Saleh, Got Key'D Realty. Realcomp II
- $68,0003 bd1 ba1.1k sqft1448 Knollwood Ave, Lansing, MI 48906For Sale
 MLS ID #295737, Missy Lord, RE/MAX Real Estate Professionals Dewitt. Greater Lansing AOR
- $90,0003 bd2 ba1.1k sqft1131 Farrand St, Lansing, MI 48906For Sale
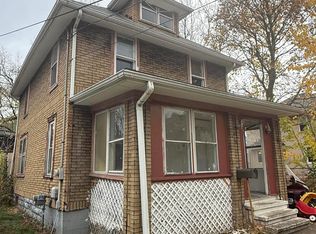 MLS ID #300389, Gary Naeyaert, EXIT Realty Home Partners. Greater Lansing AOR
- $--2 bd1 ba860 sqft1555 E Grand River Ave, Lansing, MI 48906Auction
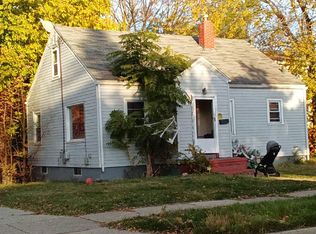 ServiceLink Auction
- $80,0002 bd1 ba719 sqft521 E Paulson St, Lansing, MI 48906For SaleMLS ID #20261060270, Brian LeBoeuf, REMAX City Centre. Realcomp II
- $70,0002 bd1 ba880 sqft1230 Lathrop St, Lansing, MI 48912For Sale
 MLS ID #50225403, Patrick McNamara, Simply Live Realty Group Inc.. MiRealSource
