$18,573
-- bd|-- ba|-- sqft
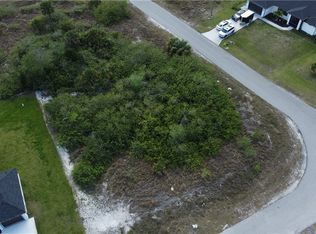
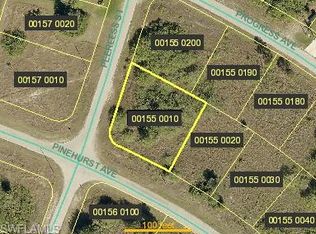
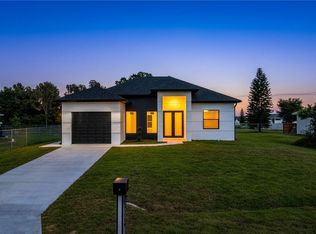
314 Progress Ave, Lehigh Acres, FL 33974
Off Market
Zillow last checked:
Listing updated:
Julieta L L Bruni 813-482-8939,
Southern Luxury Realty, LLC
$264,200
$235,000 - $296,000
$1,729/mo
| Date | Event | Price |
|---|---|---|
| 5/14/2026 | Listed for sale | $265,000$236/sqft |
Source: | ||
| 4/17/2026 | Listing removed | $1,900$2/sqft |
Source: BeachesMLS Report a problem | ||
| 4/17/2026 | Pending sale | $265,000$236/sqft |
Source: | ||
| 2/20/2026 | Price change | $1,900-9.5%$2/sqft |
Source: BeachesMLS #F10551096 Report a problem | ||
| 2/19/2026 | Price change | $265,000-3.6%$236/sqft |
Source: | ||
| 1/27/2026 | Listed for rent | $2,100$2/sqft |
Source: NABOR FL #226000330 Report a problem | ||
| 10/24/2025 | Price change | $275,000-4.8%$245/sqft |
Source: | ||
| 5/20/2025 | Price change | $289,000-3.2%$257/sqft |
Source: | ||
| 4/22/2025 | Price change | $298,500-0.5%$266/sqft |
Source: | ||
| 2/18/2025 | Price change | $299,900-1.7%$267/sqft |
Source: | ||
| 1/20/2025 | Price change | $305,000-1.6%$272/sqft |
Source: | ||
| 12/8/2024 | Listed for sale | $310,000+1191.7%$276/sqft |
Source: | ||
| 10/6/2023 | Sold | $24,000-7.7%$21/sqft |
Source: Public Record Report a problem | ||
| 9/25/2023 | Pending sale | $26,000$23/sqft |
Source: | ||
| 7/21/2023 | Listed for sale | $26,000+188.9%$23/sqft |
Source: | ||
| 7/1/2020 | Listing removed | $9,000$8/sqft |
Source: Promised Land Real Estate LLC #219074975 Report a problem | ||
| 11/17/2019 | Price change | $9,000-18.2%$8/sqft |
Source: Promised Land Real Estate LLC #219074975 Report a problem | ||
| 11/14/2019 | Price change | $11,000-8.3%$10/sqft |
Source: Promised Land Real Estate LLC #219074975 Report a problem | ||
| 11/11/2019 | Listed for sale | $12,000+358.4%$11/sqft |
Source: Promised Land Real Estate LLC #219074975 Report a problem | ||
| 3/30/2016 | Sold | $2,618$2/sqft |
Source: Public Record Report a problem | ||
| Year | Property taxes | Tax assessment |
|---|---|---|
| 2025 | $3,211 +635.3% | $223,391 +1306.1% |
| 2024 | $437 +27.1% | $15,887 +184.2% |
| 2023 | $344 +16.6% | $5,590 +10% |
| 2022 | $295 +10.6% | $5,082 +10% |
| 2021 | $266 +2.2% | $4,620 +10% |
| 2020 | $261 +124.3% | $4,200 +2.4% |
| 2019 | $116 | $4,100 +5.1% |
| 2018 | $116 +9.9% | $3,900 -8.9% |
| 2017 | $106 -3.1% | $4,280 -9.1% |
| 2016 | $109 +9.6% | $4,710 |
| 2015 | $99 +1.1% | $4,710 +92.6% |
| 2014 | $98 +45.8% | $2,445 +1.9% |
| 2013 | $67 +13.4% | $2,400 +20% |
| 2012 | $60 -29.6% | $2,000 -41.2% |
| 2011 | $85 -1.2% | $3,400 |
| 2010 | $86 -8% | $3,400 -15% |
| 2009 | $93 -38% | $4,000 -50.6% |
| 2008 | $150 -53.6% | $8,100 -57.1% |
| 2007 | $324 -54.2% | $18,900 -55% |
| 2006 | $706 +848.9% | $42,000 +1348.3% |
| 2004 | $74 +34.7% | $2,900 +70.6% |
| 2003 | $55 +10.3% | $1,700 +21.4% |
| 2002 | $50 | $1,400 |
| 2000 | -- | $1,400 |
Find assessor info on the county website
A local agent can set up tours, give advice and negotiate with sellers.