OFFER DEADLINE Monday 10/26 @ 6PM. Calling all investors, flippers and developers. Two single family homes on a 10,000 sq ft lot!!! Each home has 2 beds and 1 bath. Garage structure in the back. Homes need updates throughout. Buyers and buyers agent to complete all due diligence.
Active
$375,000
317 Harrington Ave, Warwick, RI 02888
4beds
1,600sqft
Multi Family
Built in 1919
-- sqft lot
$377,700 Zestimate®
$234/sqft
$-- HOA
What's special
- 24 days
- 1,619
- 84
Likely to sell faster than
Zillow last checked:
Listing updated:
Listed by:
Benny Troncoso 617-898-8828,
eXp Realty
Source: StateWide MLS RI,MLS#: 1426443
Facts & features
Interior
Bedrooms & bathrooms
- Bedrooms: 4
- Bathrooms: 2
- Full bathrooms: 2
Heating
- Electric, Natural Gas, Oil, Baseboard
Cooling
- None
Appliances
- Included: Electric Water Heater
Features
- Flooring: Other
- Basement: Full,Interior and Exterior,Unfinished
- Has fireplace: No
Interior area
- Total structure area: 1,600
- Total interior livable area: 1,600 sqft
Property
Parking
- Total spaces: 11
- Parking features: Detached
- Garage spaces: 1
Lot
- Size: 10,201 Square Feet
Details
- Parcel number: WARWM296B0428L0000
Construction
Type & style
- Home type: MultiFamily
- Property subtype: Multi Family
Materials
- Other Siding
Condition
- New construction: No
- Year built: 1919
Utilities & green energy
- Electric: 60 Amps
- Sewer: Public Sewer
- Water: Public
Community & HOA
HOA
- Has HOA: No
Location
- Region: Warwick
Financial & listing details
- Price per square foot: $234/sqft
- Tax assessed value: $325,300
- Annual tax amount: $5,171
- Date on market: 10/20/2026
- Total actual rent: 0
Estimated market value
$377,700
$359,000 - $397,000
$2,491/mo
Price history
| Date | Event | Price |
|---|---|---|
| 11/9/2026 | Listed for sale | $375,000$234/sqft |
Source:  StateWide MLS RI #1426443 Report a problem | ||
| 10/30/2026 | Pending sale | $375,000$234/sqft |
Source: StateWide MLS RI #1426443 Report a problem | ||
| 10/20/2026 | Listed for sale | $375,000+316.7%$234/sqft |
Source: StateWide MLS RI #1426443 Report a problem | ||
| 8/3/2001 | Sold | $90,000$56/sqft |
Source: Public Record Report a problem | ||
Public tax history
| Year | Property taxes | Tax assessment |
|---|---|---|
| 2025 | $4,707 | $325,300 |
| 2024 | $4,707 +2% | $325,300 |
| 2023 | $4,616 +13.6% | $325,300 +49.9% |
| 2022 | $4,064 | $217,000 |
| 2021 | $4,064 | $217,000 |
| 2020 | $4,064 | $217,000 |
| 2019 | $4,064 +9.6% | $217,000 +21.8% |
| 2018 | $3,707 +2.8% | $178,200 |
| 2017 | $3,607 | $178,200 |
| 2016 | $3,607 +2.9% | $178,200 +5.4% |
| 2015 | $3,507 +3.5% | $169,000 |
| 2014 | $3,390 +1.3% | $169,000 |
| 2013 | $3,345 +2.3% | $169,000 -8.6% |
| 2011 | $3,271 +1.2% | $184,900 |
| 2010 | $3,232 -10.9% | $184,900 -27.9% |
| 2009 | $3,628 +5.4% | $256,600 |
| 2008 | $3,441 +17% | $256,600 +34.9% |
| 2007 | $2,940 | $190,200 |
| 2006 | $2,940 +4.4% | $190,200 |
| 2004 | $2,817 +3.3% | $190,200 +94.1% |
| 2003 | $2,727 | $97,990 |
Find assessor info on the county website
Monthly payment
Est. payment
Payment breakdown
Explore the cost of this home by adjusting the details. Changes won't be saved.Climate risks
Neighborhood: 02888
Similar homes
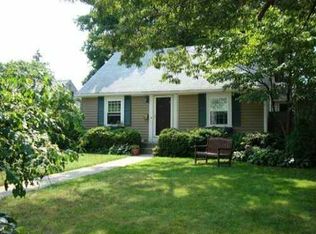
- $415,0003 bd2 ba1.1k sqft29 Arthur St, Warwick, RI 02888For Sale
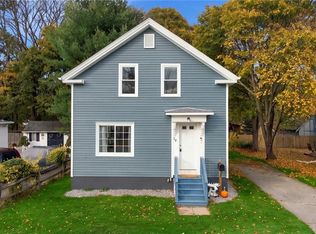
 MLS ID #1428216, Brooke Coughlin, Lamacchia Realty, Inc. StateWide MLS RI
- $529,9003 bd2 ba1.3k sqft297-299 Harrington Ave, Warwick, RI 02888For Sale
 MLS ID #1420856, Marino De La Cruz, Home Island Realty, LLC. StateWide MLS RI
- $399,9003 bd1 ba1.3k sqft24 Steele Ave, Warwick, RI 02889For Sale
 MLS ID #1428345, Kiersten Luis, Mako Realty. StateWide MLS RI
- $--3 bd1 ba816 sqft8 Aspen Way, Warwick, RI 02886Auction
 Auction.com 2
- $349,9003 bd1 ba1.8k sqft23 Brookfield Dr, Cranston, RI 02920For SaleMLS ID #1428164, Rachel McNally, Real Broker, LLC. StateWide MLS RI
- $385,0003 bd1 ba1k sqft97 Keeley Ave, Warwick, RI 02886For SaleMLS ID #1426641, Jennifer Eaton, Ocean Roads Realty LLC. StateWide MLS RI
- $395,0006 bd2 ba2k sqft124 Anthony Ave, Pawtucket, RI 02860For SaleMLS ID #1428012, Elaine Reavey, Keller Williams Coastal. StateWide MLS RI
- $450,0004 bd3 ba1.6k sqft27 Centre St, West Warwick, RI 02893For SaleMLS ID #1428403, Jackie Alvarez, JJProperty Mgmt & Multiservice. StateWide MLS RI
- $389,0003 bd2 ba1.7k sqft20 Horse Neck Rd, Warwick, RI 02889For SaleMLS ID #1423452, Jill Arnold, REMAX Revolution. StateWide MLS RI
- $425,0004 bd1 ba1.3k sqft76 Novelty Rd, Warwick, RI 02889For SaleMLS ID #1427362, Milko Ugarte, Realty Center. StateWide MLS RI
- $349,9003 bd1 ba864 sqft3086 Post Rd, Warwick, RI 02886For SaleMLS ID #1427388, Michael Pinelli, RE/MAX Preferred. StateWide MLS RI
- $445,0005 bd4 ba1.3k sqft12 Bryant St, Providence, RI 02908For SaleMLS ID #1427953, Lissette Guzman, Circle 100 Real Estate. StateWide MLS RI
- $419,9003 bd2 ba1.5k sqft48 Toledo Ave, Pawtucket, RI 02860For SaleMLS ID #1427856, Michael Capuano, World Net Real Estate Group. StateWide MLS RI
- $375,0003 bd1 ba1.5k sqft33 Huldah St, Providence, RI 02909For SaleMLS ID #1426104, Jared Granda, Century 21 Envoy. StateWide MLS RI
- $359,0002 bd2 ba1.2k sqft135 Roger Williams Ave, Providence, RI 02907For SaleMLS ID #1426196, Arthur Yatsko, Salisbury Agency. StateWide MLS RI
- $399,0002 bd1 ba1.3k sqft84 Davis Ave, Cranston, RI 02910For SaleMLS ID #1427365, Milko Ugarte, Realty Center. StateWide MLS RI
