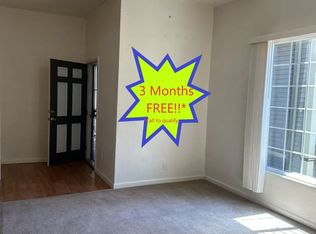
Bank Owned !!!! Handyman Special !!!! Lots of Potential !!!!!
Pre-foreclosure
Est. $662,400
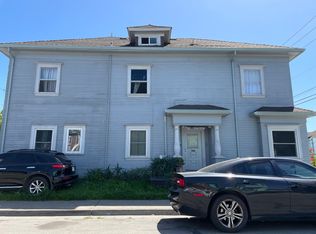
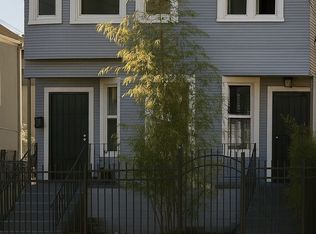
3201 Filbert St, Oakland, CA 94608
4beds
3baths
2,430sqft
MultiFamily
Built in 1892
-- sqft lot
$662,400 Zestimate®
$273/sqft
$-- HOA
Overview
- 58 days |
- 4 |
- 0 |
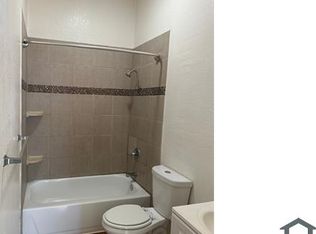
Facts & features
Interior
Bedrooms & bathrooms
- Bedrooms: 4
- Bathrooms: 3
Interior area
- Total interior livable area: 2,430 sqft
Property
Lot
- Size: 1,742 Square Feet
Details
- Parcel number: 5470102
Construction
Type & style
- Home type: MultiFamily
Materials
- wood frame
Condition
- Year built: 1892
Community & HOA
Location
- Region: Oakland
Financial & listing details
- Price per square foot: $273/sqft
- Tax assessed value: $504,760
Visit our professional directory to find a foreclosure specialist in your area that can help with your home search.
Find a foreclosure agentForeclosure details
Estimated market value
$662,400
$563,000 - $762,000
$3,069/mo
Price history
| Date | Event | Price |
|---|---|---|
| 5/19/2015 | Sold | $350,000+34.6%$144/sqft |
Source: Public Record Report a problem | ||
| 3/19/2014 | Sold | $260,000-1.8%$107/sqft |
Source: | ||
| 1/23/2014 | Price change | $264,900-5.6%$109/sqft |
Source: MRL Group, Inc. #40640617 Report a problem | ||
| 12/13/2013 | Listed for sale | $280,500-53.3%$115/sqft |
Source: MRL Group, Inc. #40640617 Report a problem | ||
| 4/4/2013 | Sold | $600,646+39.7%$247/sqft |
Source: Public Record Report a problem | ||
| 12/3/2004 | Sold | $430,000+8500%$177/sqft |
Source: Public Record Report a problem | ||
| 1/17/1995 | Sold | $5,000$2/sqft |
Source: Public Record Report a problem | ||
Public tax history
| Year | Property taxes | Tax assessment |
|---|---|---|
| 2025 | -- | $504,760 +2% |
| 2024 | $9,492 -27.6% | $494,864 +2% |
| 2023 | $13,117 +15.9% | $485,162 +2% |
| 2022 | $11,314 +20.8% | $475,650 +2% |
| 2021 | $9,369 +1.2% | $466,325 +1% |
| 2020 | $9,260 -56.8% | $461,545 -38.9% |
| 2019 | $21,436 +197.9% | $754,800 +70.1% |
| 2018 | $7,196 | $443,628 +2% |
| 2017 | $7,196 +3.7% | $434,930 +2% |
| 2016 | $6,942 +20.4% | $426,404 +26.7% |
| 2015 | $5,765 -6.8% | $336,593 -4.3% |
| 2014 | $6,187 | $351,588 +8.2% |
| 2013 | -- | $325,000 +12.1% |
| 2012 | -- | $290,000 |
| 2011 | -- | $290,000 -7.9% |
| 2010 | -- | $315,000 -32.3% |
| 2009 | -- | $465,440 +2% |
| 2008 | -- | $456,315 +2% |
| 2007 | -- | $447,371 +2% |
| 2006 | -- | $438,600 +2% |
| 2005 | -- | $430,000 +309% |
| 2004 | -- | $105,146 +1.9% |
| 2003 | -- | $103,219 +2% |
| 2002 | -- | $101,195 +2% |
| 2001 | $1,835 | $99,211 |
Find assessor info on the county website
Monthly payment
Estimated monthly payment$1,822
All calculations are estimates and provided by Zillow, Inc. for informational purposes only. Actual amounts may vary.
HOA fees may include property taxes on listings classified as Co-Ops. Contact the listing agent and/or owner for fee details.
Mortgage interest rates are dependent on a number of factors, including credit score, down payment, and repayment length. Interest rate data provided by Zillow Group Marketplace, Inc. as of 1/1/1970 from various mortgage lenders with which we have lead or other similar arrangements; the Estimated Payment is an average of those rates.
See how much you could borrow to make a competitive offer.
Climate risks
Neighborhood: Clawson
Nearby schools
GreatSchools rating
- 4/10Hoover Elementary SchoolGrades: K-5Distance: 0.2 mi
- NAHome And Hospital ProgramGrades: K-12Distance: 1.1 mi
- 2/10McClymonds High SchoolGrades: 9-12Distance: 0.3 mi


- California
- Alameda County
- Oakland
- 94608
- Clawson
- 3201 Filbert St
Nearby cities
Nearby neighborhoods
Nearby zip codes
Other Oakland Topics
