This 2669 square foot single family home has 5 bedrooms and 3.5 bathrooms. This home is located at 33 High St, Stoneham, MA 02180.
Foreclosed
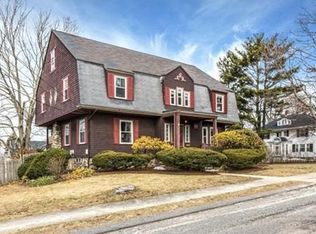
Street View
Est. $1,141,600
33 High St, Stoneham, MA 02180
5beds
3baths
2,669sqft
SingleFamily
Built in 1920
0.33 Acres Lot
$1,141,600 Zestimate®
$428/sqft
$-- HOA
Overview
- 87 days |
- 54 |
- 1 |
Facts & features
Interior
Bedrooms & bathrooms
- Bedrooms: 5
- Bathrooms: 3.5
Heating
- Other, Oil
Features
- Basement: Partially finished
- Has fireplace: Yes
Interior area
- Total interior livable area: 2,669 sqft
Property
Parking
- Parking features: Garage - Attached
Features
- Exterior features: Other
Lot
- Size: 0.33 Acres
Details
- Parcel number: STONM11B000L247
Construction
Type & style
- Home type: SingleFamily
Materials
- Frame
- Roof: Asphalt
Condition
- Year built: 1920
Community & HOA
Location
- Region: Stoneham
Financial & listing details
- Price per square foot: $428/sqft
- Tax assessed value: $1,038,800
- Annual tax amount: $10,627
Visit our professional directory to find a foreclosure specialist in your area that can help with your home search.
Find a foreclosure agentForeclosure details
Estimated market value
$1,141,600
$1.00M - $1.29M
$5,649/mo
Price history
| Date | Event | Price |
|---|---|---|
| 3/30/2026 | Sold | $876,015+27.1%$328/sqft |
Source: Public Record Report a problem | ||
| 8/28/2003 | Sold | $689,000$258/sqft |
Source: Public Record Report a problem | ||
Public tax history
| Year | Property taxes | Tax assessment |
|---|---|---|
| 2025 | $10,627 +2.8% | $1,038,800 +6.4% |
| 2024 | $10,337 +2.5% | $976,100 +7.4% |
| 2023 | $10,089 +12.5% | $908,900 +5.5% |
| 2022 | $8,970 -0.7% | $861,700 +3.2% |
| 2021 | $9,034 +3.4% | $834,900 +3.1% |
| 2020 | $8,738 +6.3% | $809,800 +10.6% |
| 2019 | $8,219 +3.3% | $732,500 +7.8% |
| 2018 | $7,955 +0.4% | $679,300 +6.2% |
| 2017 | $7,923 +5.6% | $639,500 +8.2% |
| 2016 | $7,503 +0.7% | $590,800 +2.7% |
| 2015 | $7,453 +0.2% | $575,100 +4.3% |
| 2014 | $7,440 +9.2% | $551,500 +5.7% |
| 2013 | $6,812 +0.5% | $521,600 -3% |
| 2012 | $6,780 +6.8% | $537,700 +3.4% |
| 2011 | $6,347 +7.4% | $519,800 +1.1% |
| 2010 | $5,909 +2.1% | $514,300 -3.3% |
| 2009 | $5,787 +5.4% | $531,900 -1.3% |
| 2008 | $5,491 +1.7% | $538,900 -2.8% |
| 2007 | $5,398 +0.7% | $554,200 |
| 2006 | $5,359 +2.1% | $554,200 +10.5% |
| 2005 | $5,248 +7.4% | $501,700 +24.9% |
| 2004 | $4,886 +3.9% | $401,800 |
| 2003 | $4,701 -18.7% | $401,800 +43.2% |
| 2002 | $5,784 +42% | $280,600 |
| 2000 | $4,072 +6% | $280,600 +23.8% |
| 1999 | $3,843 | $226,700 |
Find assessor info on the county website
Monthly payment
Estimated monthly payment$1,822
All calculations are estimates and provided by Zillow, Inc. for informational purposes only. Actual amounts may vary.
HOA fees may include property taxes on listings classified as Co-Ops. Contact the listing agent and/or owner for fee details.
Mortgage interest rates are dependent on a number of factors, including credit score, down payment, and repayment length. Interest rate data provided by Zillow Group Marketplace, Inc. as of 1/1/1970 from various mortgage lenders with which we have lead or other similar arrangements; the Estimated Payment is an average of those rates.
See how much you could borrow to make a competitive offer.
Climate risks
Neighborhood: 02180
Nearby schools
GreatSchools rating
- 5/10Stoneham Middle SchoolGrades: 5-8Distance: 0.5 mi
- 7/10Stoneham High SchoolGrades: 9-12Distance: 1.4 mi
- 4/10Robin Hood Elementary SchoolGrades: K-4Distance: 0.7 mi

Nearby cities
Nearby zip codes
Other Stoneham Topics
