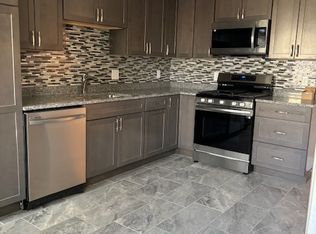
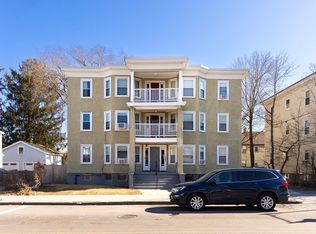
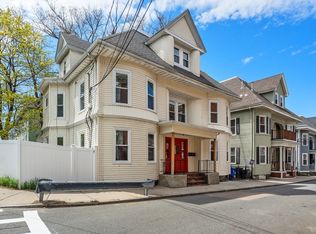
Trophy Building! Grossing 140K with minimal expenses! Large fully renovated three-family property offering three spacious units, each configured with 4 bedrooms and 2 full bathrooms. All units are identical layouts. The property has been comprehensively renovated throughout, including updated kitchens and bathrooms, flooring, modern finishes, and upgraded building systems. The renovations provide turnkey condition with minimal future maintenance requirements. Well-suited for both owner-occupants and investors, the property offers strong rental potential in a desirable Downtown Hyde Park location with convenient access to commuter rail & public transportation, major roadways, and local amenities. A rare opportunity to acquire a fully renovated multi-family asset in excellent condition. Potential ADU opportunity in the attic, with existing seperate enterance Potential condo opportunity as everything is sub-metered. Lead Certs Included. Reach out for private showings
For sale
$1,599,999
33 Oak St, Boston, MA 02136
12beds
4,626sqft
3 Family
Built in 1920
-- sqft lot
$1,222,200 Zestimate®
$346/sqft
$-- HOA
What's special
- 3 days |
- 220 |
- 17 |
Zillow last checked:
Listing updated:
Listed by:
Egi Gjikondi 781-605-8924,
Stony Brook & Lennox Realty Advisors 617-531-9077,
Egi Gjikondi 781-605-8924
Source: MLS PIN,MLS#: 73475682
Loading...
Facts & features
Interior
Bedrooms & bathrooms
- Bedrooms: 12
- Bathrooms: 6
- Full bathrooms: 6
Features
- Has basement: No
- Has fireplace: No
Interior area
- Total structure area: 4,626
- Total interior livable area: 4,626 sqft
- Finished area above ground: 4,626
Property
Parking
- Total spaces: 3
- Uncovered spaces: 3
Lot
- Size: 4,243 Square Feet
- Features: Other
Details
- Parcel number: W:18 P:09166 S:000,3366580
- Zoning: R3
Construction
Type & style
- Home type: MultiFamily
- Property subtype: 3 Family
Materials
- Foundation: Other
Condition
- Year built: 1920
Utilities & green energy
- Sewer: Public Sewer
- Water: Public
Community & HOA
Location
- Region: Boston
Financial & listing details
- Price per square foot: $346/sqft
- Tax assessed value: $1,291,800
- Annual tax amount: $14,959
- Date on market: 6/26/2026
- Total actual rent: 11655
Estimated market value
$1,222,200
$1.10M - $1.37M
$2,004/mo
Price history
| Date | Event | Price |
|---|---|---|
| 6/26/2026 | Listed for sale | $1,599,999+6.7%$346/sqft |
Source: MLS PIN #73475682 Report a problem | ||
| 4/27/2026 | Listing removed | $1,499,9990%$324/sqft |
Source: MLS PIN #73475682 Report a problem | ||
| 2/10/2026 | Listed for sale | $1,500,000+57.9%$324/sqft |
Source: MLS PIN #73475682 Report a problem | ||
| 9/26/2023 | Sold | $950,000+0%$205/sqft |
Source: MLS PIN #73140920 Report a problem | ||
| 7/27/2023 | Contingent | $949,900$205/sqft |
Source: MLS PIN #73140920 Report a problem | ||
| 7/26/2023 | Listed for sale | $949,900-45.7%$205/sqft |
Source: MLS PIN #73140920 Report a problem | ||
| 7/21/2020 | Listing removed | $1,500 |
Source: Newman and Company Report a problem | ||
| 7/21/2020 | Price change | $1,500-21.1% |
Source: Newman and Company Report a problem | ||
| 6/27/2020 | Listed for rent | $1,900 |
Source: Newman and Company Report a problem | ||
| 12/11/2019 | Listing removed | $1,900 |
Source: Zillow Rental Manager Report a problem | ||
| 6/8/2019 | Price change | $1,900+2.7% |
Source: Newman and Company Report a problem | ||
| 4/7/2019 | Price change | $1,850-27.5% |
Source: Newman and Company Report a problem | ||
| 3/5/2019 | Listed for rent | $2,550$1/sqft |
Source: Zillow Rental Network Report a problem | ||
| 5/31/2017 | Sold | $1,750,000-2.8%$378/sqft |
Source: Agent Provided Report a problem | ||
| 4/5/2017 | Pending sale | $1,800,000$389/sqft |
Source: V & E Realty #72139385 Report a problem | ||
| 4/2/2017 | Listed for sale | $1,800,000$389/sqft |
Source: V & E Realty #72139385 Report a problem | ||
Public tax history
| Year | Property taxes | Tax assessment |
|---|---|---|
| 2025 | $14,959 +31.7% | $1,291,800 +24% |
| 2024 | $11,356 +6.6% | $1,041,800 +5% |
| 2023 | $10,654 +8.6% | $992,000 +10% |
| 2022 | $9,812 +7.1% | $901,800 +5% |
| 2021 | $9,163 +42.2% | $858,800 +40.8% |
| 2020 | $6,442 +12.2% | $610,000 +12% |
| 2019 | $5,741 +15.7% | $544,700 +15% |
| 2018 | $4,962 +666.9% | $473,500 +7% |
| 2017 | $647 -85.8% | $442,500 +7% |
| 2016 | $4,550 -8.9% | $413,600 +0.3% |
| 2015 | $4,993 +5.4% | $412,300 +14.4% |
| 2013 | $4,736 -3.9% | $360,400 -4.6% |
| 2012 | $4,927 +2% | $377,800 |
| 2011 | $4,832 +6.6% | $377,800 -1% |
| 2010 | $4,533 +0.4% | $381,600 -10.1% |
| 2009 | $4,513 -24.4% | $424,600 -21.9% |
| 2008 | $5,968 -2.4% | $544,000 -2.2% |
| 2007 | $6,115 | $556,400 |
Find assessor info on the county website
Monthly payment
Est. payment$--/mo
Payment breakdown
Explore the cost of this home by adjusting the details. Changes won't be saved.All calculations are estimates and provided by Zillow, Inc. for informational purposes only. Actual amounts may vary.
HOA fees may include property taxes on listings classified as Co-Ops. Contact the listing agent and/or owner for fee details.
Mortgage interest rates are dependent on a number of factors, including credit score, down payment, and repayment length. Interest rate data provided by Zillow Group Marketplace, Inc. as of 1/1/1970 from various mortgage lenders with which we have lead or other similar arrangements; the Estimated Payment is an average of those rates.
See how much you could borrow to make a competitive offer.
Climate risks
Neighborhood: Hyde Park
Nearby schools
GreatSchools rating
- 5/10Channing Elementary SchoolGrades: PK-6Distance: 0.6 mi
- 7/10New Mission High SchoolGrades: 7-12Distance: 0.6 mi
- 1/10Another Course To CollegeGrades: 9-12Distance: 0.7 mi
A local agent can set up tours, give advice and negotiate with sellers.
A local lender can help you make sure your offer is ready when you are.


Nearby cities
Nearby neighborhoods
Nearby zip codes
Other Boston Topics
