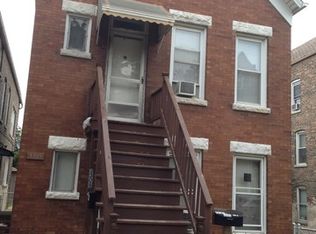
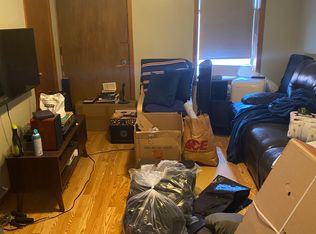
Great opportunity in Chicago's Bridgeport neighborhood near the 35th & Halsted business district! This two-unit property is in need of rehab and offers plenty of potential for investors or buyers looking to bring their vision to life. The sale includes plans and permits for a duplex-up and duplex-down layout, offering an opportunity to reconfigure the property and maximize its potential. Conveniently located near local shops, restaurants, and neighborhood amenities. Bring your ideas and explore the possibilities this property has to offer!
New
$460,000
3303 S Aberdeen St, Chicago, IL 60608
7beds
--sqft
Multi Family
Built in 1890
-- sqft lot
$-- Zestimate®
$--/sqft
$-- HOA
What's special
- --
- 60
- views
- 3
- saves
Zillow last checked:
Listing updated:
Listed by:
Luis Ortiz 773-571-0411,
RE/MAX Partners
Source: MRED as distributed by MLS GRID,MLS#: 12801289
Facts & features
Interior
Bedrooms & bathrooms
- Bedrooms: 7
- Bathrooms: 3
- Full bathrooms: 3
Heating
- Has Heating (Unspecified Type)
Features
- Basement: Unfinished,Full
Property
Parking
- Total spaces: 2
- Parking features: Yes
Lot
- Size: 2,976 Square Feet
- Dimensions: 124x24
Details
- Parcel number: 17322170160000
- Zoning: MULTI
- Special conditions: None
Construction
Type & style
- Home type: MultiFamily
- Property subtype: Multi Family
Materials
- Brick
Condition
- New construction: No
- Year built: 1890
Utilities & green energy
- Sewer: Public Sewer
- Water: Lake Michigan
Community & HOA
Location
- Region: Chicago
Financial & listing details
- Tax assessed value: $510,000
- Annual tax amount: $10,628
- Date on market: 11/4/2026
- Ownership: Fee Simple
Estimated market value
Not available
Estimated sales range
Not available
Not available
Price history
| Date | Event | Price |
|---|---|---|
| 11/4/2026 | Listing removed | $480,000 |
Source: MRED as distributed by MLS GRID #12785464 Report a problem | ||
| 10/15/2026 | Listed for sale | $480,000+41.8% |
Source:  MRED as distributed by MLS GRID #12785464 Report a problem | ||
| 12/30/2025 | Sold | $338,500+8.3% |
Source: Public Record Report a problem | ||
| 4/11/2017 | Sold | $312,500-10.7% |
Source: Public Record Report a problem | ||
| 12/23/2016 | Listing removed | $350,000 |
Source: @properties #09318219 Report a problem | ||
| 8/17/2016 | Listed for sale | $350,000 |
Source: @properties #09318219 Report a problem | ||
Public tax history
| Year | Property taxes | Tax assessment |
|---|---|---|
| 2024 | $10,246 +18.4% | $51,000 +24.4% |
| 2023 | $8,651 +2.6% | $41,000 |
| 2022 | $8,433 +2.3% | $41,000 |
| 2021 | $8,245 +36.1% | $41,000 +50.8% |
| 2020 | $6,056 -3.5% | $27,187 -13% |
| 2019 | $6,279 +1.7% | $31,250 |
| 2018 | $6,173 +2% | $31,250 +11.2% |
| 2017 | $6,050 +7.5% | $28,106 |
| 2016 | $5,629 +9.3% | $28,106 |
| 2015 | $5,150 +14.8% | $28,106 +16.2% |
| 2014 | $4,488 +2% | $24,190 |
| 2013 | $4,400 +1.4% | $24,190 |
| 2012 | $4,341 -14.6% | $24,190 -22.9% |
| 2011 | $5,083 -0.4% | $31,365 |
| 2010 | $5,104 +4.4% | $31,365 |
| 2009 | $4,891 +27.9% | $31,365 +17.6% |
| 2008 | $3,824 +1% | $26,660 |
| 2007 | $3,786 -1.1% | $26,660 |
| 2006 | $3,827 +7.6% | $26,660 +22.5% |
| 2005 | $3,556 +1% | $21,762 |
| 2004 | $3,520 +2.2% | $21,762 |
| 2003 | $3,444 +34.8% | $21,762 +53.1% |
| 2002 | $2,554 +21% | $14,218 |
| 2001 | $2,112 -7.5% | $14,218 |
| 2000 | $2,283 | $14,218 +19.6% |
| 1999 | $2,283 | $11,883 |
Find assessor info on the county website
Monthly payment
Est. payment
Payment breakdown
Explore the cost of this home by adjusting the details. Changes won't be saved.Climate risks
Neighborhood: Bridgeport
Nearby schools

Similar homes
- $499,9005 bd2 ba-- sqft3088 S Lyman St, Chicago, IL 60608New
 MLS ID #12800829, Rachel Frenzel, HomeSmart Realty Group. MRED as distributed by MLS GRID
- $450,0006 bd2 ba-- sqft3339 S Artesian Ave, Chicago, IL 60608Active
 MLS ID #12776552, Silvia Fonseca, CSC,GRI,SFR,SRES,SRS, Coldwell Banker Realty. MRED as distributed by MLS GRID
- $430,0007 bd3 ba-- sqft2703 S Hillock Ave, Chicago, IL 60608Active
 MLS ID #12661572, Bianey Soto, Realty of America, LLC. MRED as distributed by MLS GRID
- $450,0005 bd3 ba-- sqft3047 S Broad St, Chicago, IL 60608Active
 MLS ID #12769468, James Luk, Eight Corners Realty Inc. MRED as distributed by MLS GRID
