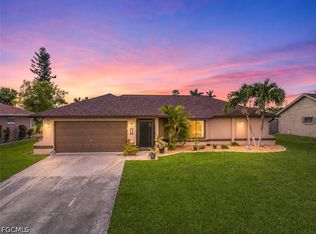
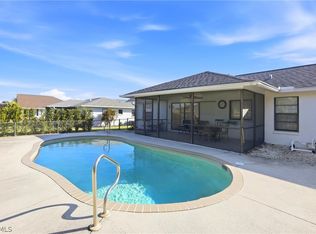
This is a great opportunity to get into SW Cape Coral for under market value! This amazing and spacious home offers just over 1900 Sq Ft and is being offered TURNKEY! Just bring your toothbrush or start renting this home out the day if closing! The home has a new roof (2020) and lots of interior upgrades! The previous owner wired the entire home to be a smart home with surround sound and Wi-Fi switches throughout! Plenty of room for a pool in the spacious backyard and the front has great curb appeal! Screened in lanai also has a great custom wood ceiling with a great beachy feel for your outdoor space! Pocket sliding glass sliders from every living space! Pool bath all ready for your pool to make this your dream backyard oasis. The home offers a 2 car garage also! In residence laundry, 2 separate living areas plus an eat in kitchen and formal dining area! This home has it all! Call today for your private tour!
Pre-foreclosure
Est. $314,600
3313 SW 6th Pl, Cape Coral, FL 33914
3beds
1,936sqft
Single Family Residence
Built in 1987
10,018 Square Feet Lot
$314,600 Zestimate®
$163/sqft
$-- HOA
Overview
- 80 days
- 12
- 2
Zillow last checked:
Source: NextHome,MLS#: 224085720
Facts & features
Interior
Bedrooms & bathrooms
- Bedrooms: 3
- Bathrooms: 2
- Full bathrooms: 2
Interior area
- Total structure area: 1,936
- Total interior livable area: 1,936 sqft
Property
Lot
- Size: 10,018 Square Feet
Details
- Parcel number: 024523C1017680250
Construction
Type & style
- Home type: SingleFamily
- Property subtype: Single Family Residence
Condition
- Year built: 1987
Community & HOA
Location
- Region: Cape Coral
Financial & listing details
- Price per square foot: $163/sqft
- Tax assessed value: $252,512
- Annual tax amount: $4,302
- Date on market: 10/25/2024
- Lease term: Contact For Details
Foreclosure details
Estimated market value
$314,600
$293,000 - $337,000
$2,278/mo
Price history
| Date | Event | Price |
|---|---|---|
| 4/26/2025 | Listing removed | $395,000+2.6%$204/sqft |
Source:  NextHome #224085720 Report a problem | ||
| 11/14/2024 | Price change | $385,000-2.5%$199/sqft |
Source:  SWFLMLS #224085720 Report a problem | ||
| 10/25/2024 | Listed for sale | $395,000+31.7%$204/sqft |
Source: SWFLMLS #224085720 Report a problem | ||
| 10/21/2021 | Sold | $300,000$155/sqft |
Source: Public Record Report a problem | ||
Public tax history
| Year | Property taxes | Tax assessment |
|---|---|---|
| 2025 | $4,302 -5.6% | $252,512 -8.7% |
| 2024 | $4,558 -1.1% | $276,566 -1.6% |
| 2023 | $4,610 +6.2% | $281,130 +3% |
| 2022 | $4,342 +249.3% | $272,942 +244.6% |
| 2021 | $1,243 +1.8% | $79,195 +1.4% |
| 2020 | $1,221 +4.4% | $78,102 -49.4% |
| 2019 | $1,170 | $154,223 +105.8% |
| 2018 | $1,170 +2% | $74,922 +2.1% |
| 2017 | $1,146 +0.6% | $73,381 -46.3% |
| 2016 | $1,140 +3.7% | $136,583 +8.2% |
| 2015 | $1,100 +1.6% | $126,204 +15.9% |
| 2014 | $1,083 +6.1% | $108,897 +11.7% |
| 2013 | $1,021 +12.5% | $97,485 +12.8% |
| 2012 | $907 -0.1% | $86,396 +20% |
| 2011 | $909 -1.4% | $71,976 +9.7% |
| 2010 | $921 -10% | $65,612 -14.2% |
| 2009 | $1,024 -21.3% | $76,490 -56.4% |
| 2008 | $1,300 -14.3% | $175,280 -14.6% |
| 2007 | $1,516 -0.3% | $205,290 +3.2% |
| 2006 | $1,521 -3.1% | $199,000 +51.9% |
| 2004 | $1,569 -1.5% | $130,970 +18.8% |
| 2003 | $1,593 +0.7% | $110,220 +3.4% |
| 2002 | $1,581 | $106,620 +24% |
| 2000 | -- | $85,970 |
Find assessor info on the county website
Monthly payment
Climate risks
Neighborhood: 33914

Similar homes
- $299,9003 bd2 ba1.5k sqft226 SW 44th Ter, Cape Coral, FL 33914For Sale
 MLS ID #2026032230, Jonathan Semple, RE/MAX Realty Team. Florida Gulf Coast MLS
- $329,9003 bd2 ba1.4k sqft4108 SW 6th Ave, Cape Coral, FL 33914For Sale
 MLS ID #2026009344, Frank Allraun, John R. Wood Properties. Florida Gulf Coast MLS
- $312,5003 bd2 ba1.5k sqft4354 SW 20th Ave, Cape Coral, FL 33914For Sale
 MLS ID #2026003994, Mike Darda, Compass Florida LLC. Florida Gulf Coast MLS
- $294,9003 bd2 ba1.9k sqft3609 SE 2nd Pl, Cape Coral, FL 33904For Sale
 MLS ID #2026035939, Doug DiBlasio, Century 21 Selling Paradise. Florida Gulf Coast MLS
- $369,0003 bd2 ba1.5k sqft2806 SW 33rd St, Cape Coral, FL 33914For SaleMLS ID #2026036565, Frank Ehrhardt, Real Broker LLC. Florida Gulf Coast MLS
- $315,0003 bd2 ba1.1k sqft7164 Bucknell Dr, Fort Myers, FL 33908For SaleMLS ID #2026046329, Jake Neuville, Compass Florida, LLC. Florida Gulf Coast MLS
- $293,0003 bd2 ba1.4k sqft926 SE 26th Ter, Cape Coral, FL 33904For SaleMLS ID #2026035705, Jason Knutson, Coldwell Banker Realty. Florida Gulf Coast MLS
- $395,0003 bd2 ba1.6k sqft242 SW 45th Ter, Cape Coral, FL 33914For SaleMLS ID #2026031380, Matthew Bonson, Century 21 Selling Paradise. Florida Gulf Coast MLS
- $425,0003 bd2 ba1.8k sqft3809 Agualinda Blvd, Cape Coral, FL 33914For SaleMLS ID #2026044165, Ted Stout, Realmark Realty Group II LLC. Florida Gulf Coast MLS
- $389,0003 bd2 ba1.5k sqft1538 SW 49th St, Cape Coral, FL 33914For SaleMLS ID #2026035766, Michael Hogentogler, Realty One Group MVP. Florida Gulf Coast MLS
- $325,0003 bd2 ba1.4k sqft1630 SW 15th Ave, Cape Coral, FL 33991For SaleMLS ID #2026017201, Jimi Walton, Schooner Bay Realty, Inc.. Florida Gulf Coast MLS
- $465,5004 bd2 ba2.3k sqft3717 Agualinda Blvd, Cape Coral, FL 33914For SaleMLS ID #2026045085, Sarah Klotzbach, Coastal Brokerage LLC. Florida Gulf Coast MLS
- $299,9002 bd2 ba1.3k sqft140 SE 8th St, Cape Coral, FL 33990For SaleMLS ID #2026018318, Cindi Infiesto, iConnect RE. Florida Gulf Coast MLS
- $370,0003 bd2 ba1.8k sqft128 SE 45th St, Cape Coral, FL 33904For SaleMLS ID #2026036625, Anthony Wallis, Blue Line Realty of SWFL. Florida Gulf Coast MLS
- $349,0003 bd2 ba1.8k sqft19 SE 21st Ave, Cape Coral, FL 33990For SaleMLS ID #2026045214, Darryl Eberly, John R. Wood Properties. Florida Gulf Coast MLS
- $384,9993 bd2 ba1.6k sqft338 SE 46th LN, CAPE CORAL, FL 33904For Sale
 MLS ID #226035820, Michael Anderson, Anderson Group Int'l Inc. SWFLMLS
- $450,0003 bd2 ba2k sqft801 SW 52nd St, Cape Coral, FL 33914For SaleMLS ID #2026026044, Capt. Mick Jensen, DomainRealty.com LLC. Florida Gulf Coast MLS
- $313,9003 bd2 ba1.9k sqft5665 Arvine Cir, Fort Myers, FL 33919For SaleMLS ID #2026003338, Jackson Simison, Royal Shell Real Estate, Inc.. Florida Gulf Coast MLS
- $396,0003 bd2 ba1.4k sqft2501 SW 52nd Ter, Cape Coral, FL 33914For SaleMLS ID #2026019519, Charles Poladian, Premiere Plus Realty Company. Florida Gulf Coast MLS
- $270,0002 bd2 ba1k sqft922 SW 48th Ter APT 115, Cape Coral, FL 33914For SaleMLS ID #2026043746, Cynthia Garcia, The Landmark Group SWFL LLC. Florida Gulf Coast MLS
