Excellent opportunity to own a two-unit building in San Francisco. The property consists of two tenant-occupied flats, each offering 2 bedrooms, 1 bathroom, a living room, and an eat-in kitchen. Both units feature functional floor plans with comfortable living spaces and generously sized kitchens with room for dining. The top-floor flat also includes an additional room located above the stairs, providing valuable bonus space with a variety of potential uses. 3328-3330 26th Street presents an attractive opportunity for an investor seeking a classic San Francisco two-unit property with existing tenants and income in place.
For sale
$698,000
3328-3330 26th St, San Francisco, CA 94110
4beds
2,090sqft
Duplex
Built in 1900
-- sqft lot
$-- Zestimate®
$334/sqft
$-- HOA
What's special
- 17 days
- 3,029
- 170
Zillow last checked:
Listing updated:
Listed by:
Jeff J. Appenrodt DRE #01336153 415-601-2779,
Laurel Realty & Investment 415-601-2779
Source: SFAR,MLS#: 426167274 Originating MLS: San Francisco Association of REALTORS
Facts & features
Interior
Bedrooms & bathrooms
- Bedrooms: 4
- Bathrooms: 2
- Full bathrooms: 2
Heating
- Natural Gas
Appliances
- Included: Free-Standing Gas Range, Free-Standing Refrigerator, Microwave
Features
- Flooring: Carpet
Interior area
- Total structure area: 2,090
- Total interior livable area: 2,090 sqft
Property
Lot
- Size: 1,237 Square Feet
- Features: Corner Lot, Other
Details
- Parcel number: 6527015
- Special conditions: Standard
Construction
Type & style
- Home type: MultiFamily
- Property subtype: Duplex
Condition
- Year built: 1900
Community & HOA
Community
- Security: Smoke Detector(s)
HOA
- Has HOA: No
Location
- Region: San Francisco
- Elevation: 0
Financial & listing details
- Price per square foot: $334/sqft
- Tax assessed value: $960,267
- Annual tax amount: $12,431
- Price range: $698K - $698K
- Date on market: 10/1/2026
- Cumulative days on market: 18 days
- Total actual rent: 4268
Estimated market value
Not available
Estimated sales range
Not available
$5,477/mo
Price history
| Date | Event | Price |
|---|---|---|
| 10/2/2026 | Listed for sale | $698,000+32.1%$334/sqft |
Source:  SFAR #426167274 Report a problem | ||
| 5/20/2026 | Sold | $528,200-33.9%$253/sqft |
Source: Public Record Report a problem | ||
| 2/16/2026 | Listing removed | $799,000$382/sqft |
Source:  BAREIS #425039303 Report a problem | ||
| 6/26/2025 | Price change | $799,000-10.7%$382/sqft |
Source: BAREIS #425039303 Report a problem | ||
| 5/12/2025 | Listed for sale | $895,000-5.8%$428/sqft |
Source: BAREIS #425039303 Report a problem | ||
| 4/1/2025 | Listing removed | $950,000$455/sqft |
Source: BAREIS #424079651 Report a problem | ||
| 11/13/2024 | Listed for sale | $950,000+18.9%$455/sqft |
Source: BAREIS #424079651 Report a problem | ||
| 3/31/2015 | Sold | $799,000$382/sqft |
Source: Public Record Report a problem | ||
Public tax history
| Year | Property taxes | Tax assessment |
|---|---|---|
| 2025 | $12,431 +0.4% | $960,267 +2% |
| 2024 | $12,386 +4.6% | $941,439 +2% |
| 2023 | $11,843 +2.1% | $922,981 +2% |
| 2022 | $11,598 +1.8% | $904,884 +2% |
| 2021 | $11,392 -6.1% | $887,142 +1% |
| 2020 | $12,127 +8.6% | $878,047 +2% |
| 2019 | $11,164 +3.5% | $860,832 +2% |
| 2018 | $10,787 +4.1% | $843,954 +2% |
| 2017 | $10,364 +1.8% | $827,407 +2% |
| 2016 | $10,178 +151.6% | $811,184 +178.3% |
| 2015 | $4,045 +2.6% | $291,427 +2% |
| 2014 | $3,943 | $285,719 +0.5% |
| 2013 | -- | $284,429 +2% |
| 2012 | -- | $278,853 +2% |
| 2011 | -- | $273,370 +0.7% |
| 2010 | -- | $271,347 -0.2% |
| 2009 | -- | $271,991 +2% |
| 2008 | -- | $266,659 +2% |
| 2007 | -- | $261,431 +2% |
| 2006 | -- | $256,306 +2% |
| 2005 | -- | $251,281 +3.9% |
| 2003 | -- | $241,841 +2% |
| 2002 | -- | $237,103 +2% |
| 2001 | -- | $232,453 +2% |
| 2000 | -- | $227,895 |
Find assessor info on the county website
Monthly payment
Est. payment
Payment breakdown
Explore the cost of this home by adjusting the details. Changes won't be saved.Climate risks
Neighborhood: Mission

Similar homes
- $749,0002 bd2 ba1.1k sqft47 Octavia St, San Francisco, CA 94102For Sale
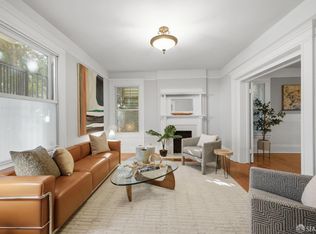 MLS ID #426170360, Bianca Kofman Baca DRE #02125553, Park North Real Estate. SFAR
- $899,0003 bd2 ba1.5k sqft22 Appleton Ave, San Francisco, CA 94110For Sale
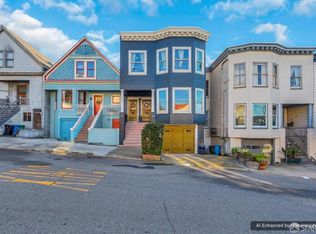 MLS ID #426155888, Christopher Lee DRE #02120811, NEXTGEN Properties. SFAR
- $695,0005 bd2 ba2.2k sqft3225 Market St, Emeryville, CA 94608For Sale
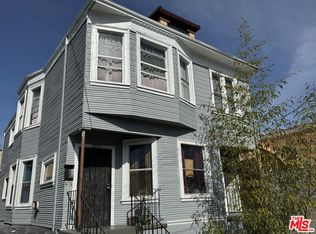 MLS ID #26874473, Sam Arash Far DRE # 01940726, Beverly & Company Luxury Properties. CLAW
- $999,0004 bd2 ba2k sqft3444 Jennings St, San Francisco, CA 94124For Sale
 MLS ID #426159298, Dimitris S. Drolapas DRE #01883765, Coldwell Banker Commercial Rea. SFAR
