Great investment opportunity! This duplex is currently generating **$1,000 in monthly rental income**, making it an excellent opportunity for investors looking to add to their rental portfolio or someone interested in purchasing an income-producing property. With two separate units, this property offers the potential for steady cash flow and long-term investment growth. Don't miss your chance to own an income-producing property!
For sale
$140,000
3367 Hardin Ave, Memphis, TN 38122
4beds
1,605sqft
Duplex
Built in 1960
-- sqft lot
$152,300 Zestimate®
$87/sqft
$-- HOA
What's special
Two separate units
- 3 days
- 90
- 1
Likely to sell faster than
Zillow last checked:
Listing updated:
Listed by:
Qazi S Ahmad,
Renshaw Company, REALTORS 901-820-4367,
Jessica Ennis,
Renshaw Company, REALTORS
Source: MAAR,MLS#: 10234557
Facts & features
Interior
Bedrooms & bathrooms
- Bedrooms: 4
- Bathrooms: 2
- Full bathrooms: 2
Heating
- Electric
Cooling
- Electric
Appliances
- Included: Electric Water Heater
Features
- Separate Living Room
- Flooring: Hardwood
Interior area
- Total interior livable area: 1,605 sqft
Property
Parking
- Parking features: Driveway/Pad
- Has uncovered spaces: Yes
Features
- Stories: 1
- Pool features: None
Lot
- Size: 10,000 Square Feet
- Dimensions: 50 x 200
- Features: Level, Some Trees
Details
- Parcel number: 038027 00034
Construction
Type & style
- Home type: MultiFamily
- Architectural style: Traditional
- Property subtype: Duplex
Materials
- Brick Veneer
Condition
- Year built: 1960
Community & HOA
Community
- Subdivision: Eddie Mae
Location
- Region: Memphis
Financial & listing details
- Price per square foot: $87/sqft
- Tax assessed value: $138,700
- Annual tax amount: $2,924
- Date on market: 11/18/2026
- Listing terms: Conventional,Other (See Remarks)
- Lease term: 12 Months
Estimated market value
$152,300
$131,000 - $172,000
$1,093/mo
Price history
| Date | Event | Price |
|---|---|---|
| 11/18/2026 | Listed for sale | $140,000+64.7%$87/sqft |
Source:  MAAR #10234557 Report a problem | ||
| 5/28/2025 | Sold | $85,000-40.8%$53/sqft |
Source: Public Record Report a problem | ||
| 5/30/2024 | Sold | $143,500-7.4%$89/sqft |
Source:  RealTracs MLS as distributed by MLS GRID #3085197 Report a problem | ||
| 4/29/2024 | Pending sale | $154,900$97/sqft |
Source: MAAR #10167544 Report a problem | ||
| 4/25/2024 | Price change | $154,900-0.1%$97/sqft |
Source: MAAR #10167544 Report a problem | ||
| 3/9/2024 | Listed for sale | $155,000+22.5%$97/sqft |
Source: MAAR #10167544 Report a problem | ||
| 3/8/2024 | Listing removed | -- |
Source: Zillow Rentals Report a problem | ||
| 2/21/2024 | Listed for rent | $795+8.2% |
Source: Zillow Rentals Report a problem | ||
| 2/13/2024 | Listing removed | -- |
Source: Zillow Rentals Report a problem | ||
| 2/2/2024 | Price change | $735-2% |
Source: Zillow Rentals Report a problem | ||
| 12/2/2023 | Listed for rent | $750 |
Source: Zillow Rentals Report a problem | ||
| 10/22/2021 | Sold | $126,500+301.6%$79/sqft |
Source: MAAR #10107341 Report a problem | ||
| 1/6/2021 | Sold | $31,500-41.7%$20/sqft |
Source: Public Record Report a problem | ||
| 11/11/2020 | Listed for sale | $54,000$34/sqft |
Source: Hayes Homes and Realty, Inc #10085779 Report a problem | ||
| 10/16/2020 | Pending sale | $54,000$34/sqft |
Source: Hayes Homes and Realty, Inc #10085779 Report a problem | ||
| 9/28/2020 | Listed for sale | $54,000+38.8%$34/sqft |
Source: Hayes Homes and Realty, Inc #10085779 Report a problem | ||
| 6/17/2020 | Listing removed | $38,900$24/sqft |
Source: Hayes Homes and Realty, Inc #10072976 Report a problem | ||
| 3/17/2020 | Listed for sale | $38,900+1196.7%$24/sqft |
Source: Hayes Homes and Realty, Inc #10072976 Report a problem | ||
| 5/3/2019 | Sold | $3,000-75%$2/sqft |
Source: Public Record Report a problem | ||
| 2/28/2015 | Listing removed | $12,000$7/sqft |
Source: Vflyer Homes Report a problem | ||
| 1/14/2015 | Listed for sale | $12,000-85.4%$7/sqft |
Source: Vflyer Homes Report a problem | ||
| 8/15/2012 | Sold | $81,970+17.3%$51/sqft |
Source: Public Record Report a problem | ||
| 8/12/2002 | Sold | $69,900$44/sqft |
Source: Public Record Report a problem | ||
Public tax history
| Year | Property taxes | Tax assessment |
|---|---|---|
| 2025 | $2,924 +180.3% | $55,480 +250.3% |
| 2024 | $1,043 +8.1% | $15,840 |
| 2023 | $965 | $15,840 |
| 2022 | -- | $15,840 +60% |
| 2021 | -- | $9,900 +16.5% |
| 2020 | $272 | $8,500 |
| 2019 | $272 -21.1% | $8,500 |
| 2018 | $344 -45.1% | $8,500 |
| 2017 | $627 +99.5% | $8,500 -8.1% |
| 2016 | $315 -24.6% | $9,250 |
| 2014 | $417 | $9,250 |
| 2013 | -- | $9,250 -29.3% |
| 2012 | -- | $13,075 |
| 2011 | -- | $13,075 |
| 2010 | -- | $13,075 |
| 2009 | -- | $13,075 -5.6% |
| 2008 | -- | $13,850 |
| 2007 | -- | $13,850 |
| 2006 | -- | $13,850 |
| 2005 | -- | $13,850 -13.3% |
| 2004 | -- | $15,975 |
| 2003 | -- | $15,975 -27.1% |
| 2002 | -- | $21,920 |
| 2001 | -- | $21,920 +19.9% |
| 2000 | -- | $18,280 |
Find assessor info on the county website
Monthly payment
Est. payment
Payment breakdown
Explore the cost of this home by adjusting the details. Changes won't be saved.Climate risks
Neighborhood: Berclair-Highland Heights


Similar homes
- $160,0004 bd2 ba1.7k sqft1055 Treadwell St, Memphis, TN 38122For Sale
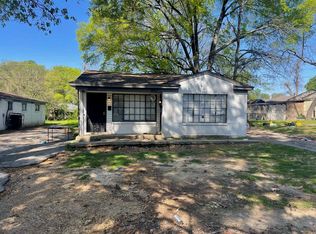 MLS ID #10221230, Jimmie L Tapley, Crye-Leike, Inc., REALTORS. MAAR
- $150,0003 bd1 ba1.2k sqft3607 Bayliss Ave, Memphis, TN 38122For Sale
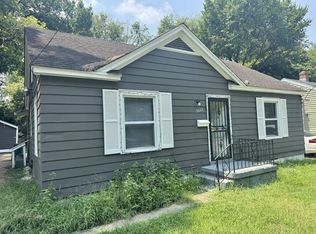 MLS ID #10229443, Scott Housewirth, Crye-Leike Inc., REALTORS. MAAR
- $125,0003 bd1 ba1.1k sqft3614 Suzanne Dr, Memphis, TN 38127For Sale
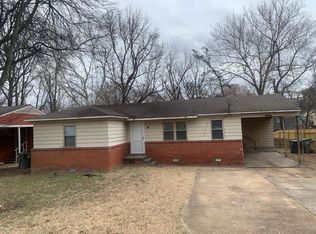 MLS ID #10234759, Adam T Watson, Keller Williams. MAAR
- $140,0004 bd1 ba1.6k sqft3878 Sybil St, Memphis, TN 38127For Sale
 MLS ID #10234350, Brett A Bernard, The Stamps Real Estate Company. MAAR
- $79,0004 bd2 ba1.7k sqft1657 Gowan Dr, Memphis, TN 38127For Sale
 MLS ID #3638225, Jennifer Carstensen. RealTracs MLS as distributed by MLS GRID
