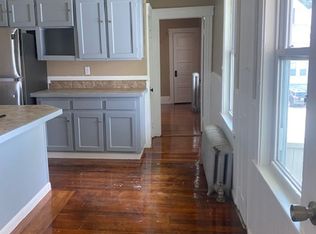
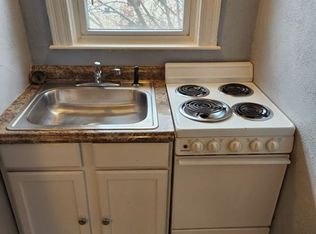
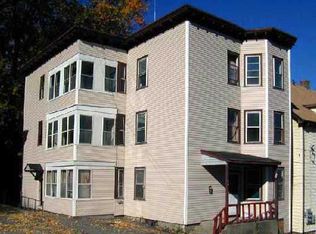
Well-maintained four-unit multifamily located in the Bernon District of Woonsocket. This property has had many updates. Fully occupied generating over $65000 a year in rents. If you are investor or want to be owner occupied you should see this home. This property provides immediate income and long-term stability for investors or owner occupants. It is in the R4 zone district. Two units will be vacant at closing.
Pending
Price cut: $24.9K (6/2)
$599,999
346 Carrington Ave, Woonsocket, RI 02895
8beds
4,740sqft
Multi Family
Built in 1920
-- sqft lot
$592,400 Zestimate®
$127/sqft
$-- HOA
What's special
- 138 days |
- 256 |
- 16 |
Zillow last checked:
Listing updated:
Listed by:
John Zadroga 508-294-0500,
eXp Realty
Source: StateWide MLS RI,MLS#: 1404951
Facts & features
Interior
Bedrooms & bathrooms
- Bedrooms: 8
- Bathrooms: 4
- Full bathrooms: 4
Heating
- Natural Gas, Oil, Gas Connected, Steam
Cooling
- None
Appliances
- Included: Electric Water Heater, Gas Water Heater
Features
- Plumbing (Mixed), Insulation (Walls)
- Flooring: Ceramic Tile, Hardwood, Other
- Basement: Full,Walk-Out Access,Partially Finished
- Has fireplace: No
Interior area
- Total structure area: 6,886
- Total interior livable area: 4,740 sqft
Video & virtual tour
Property
Parking
- Total spaces: 8
- Parking features: No Garage
Features
- Patio & porch: Porch
Lot
- Size: 6,969 Square Feet
Details
- Parcel number: WOONM27CL53U14
- Zoning: R4
Construction
Type & style
- Home type: MultiFamily
- Property subtype: Multi Family
- Attached to another structure: Yes
Materials
- Vinyl Siding
Condition
- New construction: No
- Year built: 1920
Utilities & green energy
- Electric: Circuit Breakers
- Sewer: Public Sewer
- Utilities for property: Water Connected
Community & HOA
Community
- Subdivision: Bernon District
HOA
- Has HOA: No
Location
- Region: Woonsocket
Financial & listing details
- Price per square foot: $127/sqft
- Tax assessed value: $402,600
- Annual tax amount: $4,955
- Date on market: 2/14/2026
- Total actual rent: 5420
- Tenant pays: Heat
Estimated market value
$592,400
$563,000 - $622,000
$1,956/mo
Price history
| Date | Event | Price |
|---|---|---|
| 6/10/2026 | Pending sale | $599,999$127/sqft |
Source: | ||
| 6/2/2026 | Price change | $599,999-4%$127/sqft |
Source: | ||
| 5/24/2026 | Price change | $624,900-0.8%$132/sqft |
Source: | ||
| 5/19/2026 | Price change | $629,900-0.8%$133/sqft |
Source: | ||
| 4/28/2026 | Price change | $635,000-2.3%$134/sqft |
Source: eXp Realty #1404951 Report a problem | ||
| 2/14/2026 | Price change | $650,000+36.8%$137/sqft |
Source: | ||
| 1/9/2023 | Pending sale | $475,000+6.5%$100/sqft |
Source: | ||
| 1/4/2023 | Sold | $446,000-6.1%$94/sqft |
Source: | ||
| 12/19/2022 | Contingent | $475,000$100/sqft |
Source: | ||
| 9/3/2022 | Price change | $475,000-9.5%$100/sqft |
Source: | ||
| 7/2/2022 | Listed for sale | $525,000+144.2%$111/sqft |
Source: | ||
| 7/3/2018 | Sold | $215,000-1.8%$45/sqft |
Source: | ||
| 6/5/2018 | Listed for sale | $219,000$46/sqft |
Source: RE/MAX Properties #1194066 Report a problem | ||
| 2/14/2018 | Listing removed | $219,000$46/sqft |
Source: RE/MAX Properties #1173992 Report a problem | ||
| 9/22/2017 | Price change | $219,000-2.7%$46/sqft |
Source: RE/MAX Properties #1173992 Report a problem | ||
| 6/9/2017 | Listed for sale | $225,000$47/sqft |
Source: EXIT Realty Pinnacle #1156718 Report a problem | ||
| 5/6/2017 | Listing removed | $225,000$47/sqft |
Source: EXIT REALTY PINNACLE #1156718 Report a problem | ||
| 5/5/2017 | Pending sale | $225,000$47/sqft |
Source: EXIT Realty Pinnacle #1156718 Report a problem | ||
| 4/16/2017 | Listed for sale | $225,000+36.4%$47/sqft |
Source: EXIT Realty Pinnacle #1156718 Report a problem | ||
| 1/23/2013 | Listing removed | $164,999$35/sqft |
Source: The Real Estate Book #1031460 Report a problem | ||
| 1/8/2013 | Price change | $164,9990%$35/sqft |
Source: The Real Estate Book #1031460 Report a problem | ||
| 10/9/2012 | Price change | $165,000+13.8%$35/sqft |
Source: Rent Purchase.com #1023960 Report a problem | ||
| 8/17/2012 | Listed for sale | $145,000+107.1%$31/sqft |
Source: Rent Purchase.com #1023960 Report a problem | ||
| 7/11/2012 | Sold | $70,000-22.2%$15/sqft |
Source: Agent Provided Report a problem | ||
| 3/9/2012 | Listed for sale | $90,000+38.5%$19/sqft |
Source: RE/MAX Welcome Home #71348843 Report a problem | ||
| 3/18/2011 | Sold | $65,000-50.8%$14/sqft |
Source: Agent Provided Report a problem | ||
| 5/27/2010 | Sold | $132,000-61.2%$28/sqft |
Source: Public Record Report a problem | ||
| 7/10/2007 | Sold | $340,000$72/sqft |
Source: Public Record Report a problem | ||
Public tax history
| Year | Property taxes | Tax assessment |
|---|---|---|
| 2025 | $5,854 | $402,600 |
| 2024 | $5,854 +4% | $402,600 |
| 2023 | $5,628 | $402,600 |
| 2022 | $5,628 +34.8% | $402,600 +129% |
| 2021 | $4,175 -31.7% | $175,800 |
| 2020 | $6,109 -3.3% | $175,800 -3.1% |
| 2018 | $6,318 +42.1% | $181,500 +22.9% |
| 2017 | $4,446 -5.5% | $147,700 |
| 2016 | $4,703 -13% | $147,700 |
| 2015 | $5,403 +0.9% | $147,700 +10.3% |
| 2014 | $5,355 +15.7% | $133,900 |
| 2013 | $4,628 +7.1% | $133,900 +900% |
| 2012 | $4,320 +0.7% | $13,390 -92.2% |
| 2011 | $4,290 +6.2% | $170,900 |
| 2010 | $4,038 +5.7% | $170,900 |
| 2009 | $3,821 +13.6% | $170,900 -32.8% |
| 2008 | $3,363 +7.3% | $254,200 +0.6% |
| 2006 | $3,133 +7.7% | $252,700 +107.1% |
| 2004 | $2,910 | $122,000 |
Find assessor info on the county website
Monthly payment
Est. payment$--/mo
Payment breakdown
Explore the cost of this home by adjusting the details. Changes won't be saved.All calculations are estimates and provided by Zillow, Inc. for informational purposes only. Actual amounts may vary.
HOA fees may include property taxes on listings classified as Co-Ops. Contact the listing agent and/or owner for fee details.
Mortgage interest rates are dependent on a number of factors, including credit score, down payment, and repayment length. Interest rate data provided by Zillow Group Marketplace, Inc. as of 1/1/1970 from various mortgage lenders with which we have lead or other similar arrangements; the Estimated Payment is an average of those rates.
See how much you could borrow to make a competitive offer.
Climate risks
Neighborhood: Bernon District
Nearby schools
GreatSchools rating
- 4/10Bernon Heights SchoolGrades: K-5Distance: 0.5 mi
- 3/10Woonsocket Middle at HamletGrades: 6-8Distance: 0.2 mi
- NAWoonsocket Career An Tech CenterGrades: 9-12Distance: 0.9 mi
A local agent can set up tours, give advice and negotiate with sellers.
A local lender can help you make sure your offer is ready when you are.


- Rhode Island
- Providence County
- Woonsocket
- 02895
- Bernon District
- 346 Carrington Ave
Nearby cities
Nearby neighborhoods
Nearby zip codes
Other Woonsocket Topics
