This 2640 square foot single family home has 3 bedrooms and 3.5 bathrooms. This home is located at 3515 Oak Cliff Dr, Fallbrook, CA 92028.
Pre-foreclosure
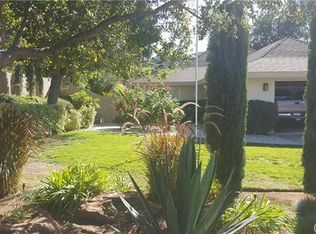
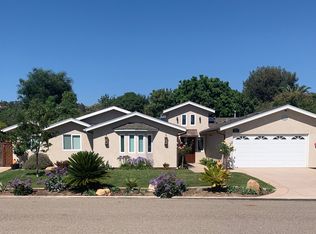
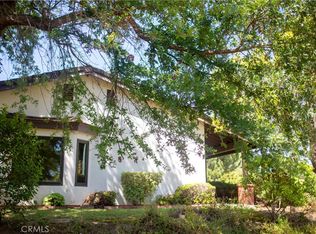
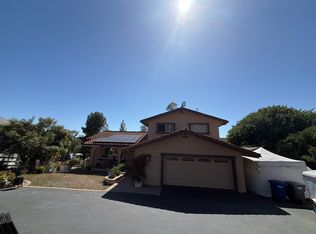
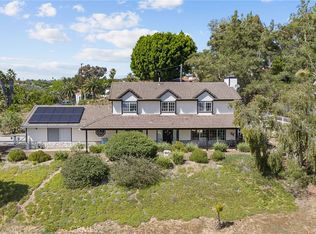
Street View
Est. $946,600
3515 Oak Cliff Dr, Fallbrook, CA 92028
3beds
3baths
2,640sqft
SingleFamily
Built in 1965
10,082 Square Feet Lot
$946,600 Zestimate®
$359/sqft
$243/mo HOA
Overview
- 13 days |
- 9 |
- 0 |
Facts & features
Interior
Bedrooms & bathrooms
- Bedrooms: 3
- Bathrooms: 3.5
Interior area
- Total interior livable area: 2,640 sqft
Property
Lot
- Size: 10,082 Square Feet
Details
- Parcel number: 1242401600
Construction
Type & style
- Home type: SingleFamily
Condition
- Year built: 1965
Community & HOA
HOA
- Has HOA: Yes
- HOA fee: $243 monthly
Location
- Region: Fallbrook
Financial & listing details
- Price per square foot: $359/sqft
- Tax assessed value: $888,515
- Annual tax amount: $9,325
Visit our professional directory to find a foreclosure specialist in your area that can help with your home search.
Find a foreclosure agentForeclosure details
Estimated market value
$946,600
$890,000 - $1.01M
$4,157/mo
Price history
| Date | Event | Price |
|---|---|---|
| 6/21/2022 | Sold | $837,275+1.5%$317/sqft |
Source: | ||
| 5/9/2022 | Pending sale | $825,000$313/sqft |
Source: | ||
| 4/15/2022 | Listed for sale | $825,000+336.5%$313/sqft |
Source: | ||
| 9/4/1997 | Sold | $189,000$72/sqft |
Source: Public Record Report a problem | ||
Public tax history
| Year | Property taxes | Tax assessment |
|---|---|---|
| 2025 | $9,325 +3.6% | $888,515 +3.7% |
| 2024 | $8,997 +10.1% | $857,000 +9.9% |
| 2023 | $8,173 +515% | $780,000 +499.5% |
| 2022 | $1,329 -74.8% | $130,098 +2% |
| 2021 | $5,267 +307.1% | $127,548 +1% |
| 2020 | $1,294 +5.5% | $126,241 +2% |
| 2019 | $1,226 -3.7% | $123,767 +2% |
| 2018 | $1,273 +2.1% | $121,341 +2% |
| 2017 | $1,247 +2.6% | $118,962 +2% |
| 2016 | $1,215 +1.6% | $116,630 +1.5% |
| 2015 | $1,196 +2% | $114,879 +2% |
| 2014 | $1,172 | $112,630 +0.5% |
| 2013 | -- | $112,122 +2% |
| 2012 | -- | $109,924 +2% |
| 2011 | -- | $107,769 +0.8% |
| 2010 | -- | $106,965 -0.2% |
| 2009 | -- | $107,220 +2% |
| 2008 | -- | $105,119 +2% |
| 2007 | -- | $103,059 +2% |
| 2006 | -- | $101,039 +2% |
| 2005 | -- | $99,059 +2% |
| 2004 | -- | $97,118 +1.9% |
| 2003 | -- | $95,339 +2% |
| 2002 | -- | $93,471 +4% |
| 2001 | -- | $89,843 |
Find assessor info on the county website
Monthly payment
Estimated monthly payment$1,822
All calculations are estimates and provided by Zillow, Inc. for informational purposes only. Actual amounts may vary.
HOA fees may include property taxes on listings classified as Co-Ops. Contact the listing agent and/or owner for fee details.
Mortgage interest rates are dependent on a number of factors, including credit score, down payment, and repayment length. Interest rate data provided by Zillow Group Marketplace, Inc. as of 1/1/1970 from various mortgage lenders with which we have lead or other similar arrangements; the Estimated Payment is an average of those rates.
See how much you could borrow to make a competitive offer.
Climate risks
Neighborhood: 92028
Nearby schools
GreatSchools rating
- 8/10Bonsall West Elementary SchoolGrades: K-6Distance: 7.9 mi
- 6/10Norman L. Sullivan Middle SchoolGrades: 6-8Distance: 2.7 mi
- 5/10Bonsall HighGrades: 9-12Distance: 2.7 mi

- California
- San Diego County
- Fallbrook
- 92028
- 3515 Oak Cliff Dr
Nearby cities
Nearby zip codes
Other Fallbrook Topics
