Brokered And Advertised By: AB American Dream Homes Inc. Listing Agent: Julio Andia
Pre-foreclosure
Est. $698,300
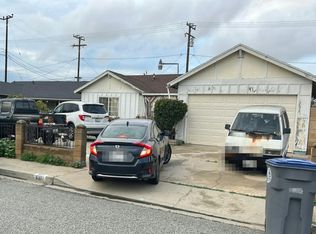
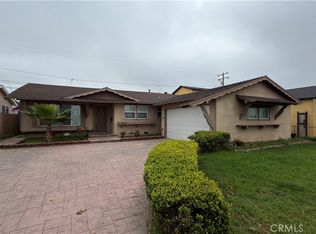
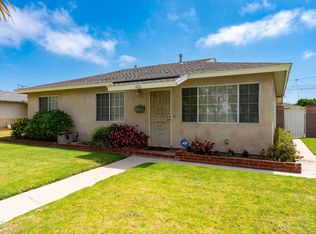
3540 Las Tunas St, Oxnard, CA 93033
4beds
2baths
1,199sqft
SingleFamily
Built in 1962
6,098 Square Feet Lot
$698,300 Zestimate®
$582/sqft
$-- HOA
Overview
- 111 days |
- 11 |
- 0 |
Facts & features
Interior
Bedrooms & bathrooms
- Bedrooms: 4
- Bathrooms: 2
Interior area
- Total interior livable area: 1,199 sqft
Property
Parking
- Parking features: Garage - Attached
Lot
- Size: 6,098 Square Feet
Details
- Parcel number: 2190373055
Construction
Type & style
- Home type: SingleFamily
Condition
- Year built: 1962
Community & HOA
Location
- Region: Oxnard
Financial & listing details
- Price per square foot: $582/sqft
- Tax assessed value: $388,789
- Annual tax amount: $4,737
Visit our professional directory to find a foreclosure specialist in your area that can help with your home search.
Find a foreclosure agentForeclosure details
Estimated market value
$698,300
$663,000 - $733,000
$3,912/mo
Price history
| Date | Event | Price |
|---|---|---|
| 4/8/2015 | Sold | $323,500+4.4%$270/sqft |
Source: Public Record Report a problem | ||
| 12/21/2014 | Listing removed | $310,000$259/sqft |
Source: AB American Dream Homes Inc. #SR14150372 Report a problem | ||
| 7/28/2014 | Listed for sale | $310,000+31.9%$259/sqft |
Source: AB American Dream Homes Inc. #SR14150372 Report a problem | ||
| 1/16/2002 | Sold | $235,000$196/sqft |
Source: Public Record Report a problem | ||
Public tax history
| Year | Property taxes | Tax assessment |
|---|---|---|
| 2025 | $4,737 +8.1% | $388,789 +2% |
| 2024 | $4,382 | $381,166 +2% |
| 2023 | $4,382 +2.1% | $373,693 +2% |
| 2022 | $4,292 -1.2% | $366,366 +2% |
| 2021 | $4,345 -1.8% | $359,183 +1% |
| 2020 | $4,425 +3.1% | $355,502 +2% |
| 2019 | $4,292 +3.8% | $348,533 +2% |
| 2018 | $4,134 +3.3% | $341,700 +2% |
| 2017 | $4,001 +5% | $335,001 +2% |
| 2016 | $3,810 +9.1% | $328,433 +12.6% |
| 2015 | $3,492 +1.8% | $291,608 +2% |
| 2014 | $3,429 | $285,898 +0.5% |
| 2013 | -- | $284,608 +29.4% |
| 2012 | -- | $220,000 -6% |
| 2011 | -- | $234,000 -6% |
| 2009 | -- | $249,000 -4.8% |
| 2007 | -- | $261,596 +2% |
| 2006 | -- | $256,468 +2% |
| 2005 | -- | $251,440 +3.9% |
| 2003 | -- | $241,995 +52.5% |
| 2002 | -- | $158,659 +2% |
| 2001 | $1,764 +1.5% | $155,549 +2% |
| 2000 | $1,737 | $152,500 |
Find assessor info on the county website
Monthly payment
Estimated monthly payment$1,822
All calculations are estimates and provided by Zillow, Inc. for informational purposes only. Actual amounts may vary.
HOA fees may include property taxes on listings classified as Co-Ops. Contact the listing agent and/or owner for fee details.
Mortgage interest rates are dependent on a number of factors, including credit score, down payment, and repayment length. Interest rate data provided by Zillow Group Marketplace, Inc. as of 1/1/1970 from various mortgage lenders with which we have lead or other similar arrangements; the Estimated Payment is an average of those rates.
See how much you could borrow to make a competitive offer.
Climate risks
Neighborhood: Blackstock South
Nearby schools
GreatSchools rating
- 4/10Ansgar Larsen Elementary SchoolGrades: K-5Distance: 0.2 mi
- 3/10Charles Blackstock Junior High SchoolGrades: 6-8Distance: 0.3 mi
- 4/10Channel Islands High SchoolGrades: 9-12Distance: 0.5 mi

- California
- Ventura County
- Oxnard
- 93033
- Blackstock South
- 3540 Las Tunas St
Nearby cities
Nearby neighborhoods
Nearby zip codes
Other Oxnard Topics
