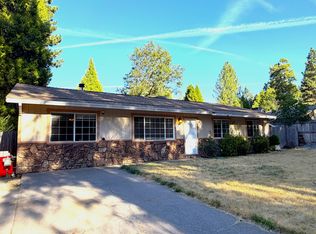
3/2 mountain charmer nestled in the pine and black oak trees. Located within 10 miles of the spectacular Burney Falls. Newer roof. All stainless steel appliances, less than 3 years old. High-end convection oven. Sunroom has 2 sun lights, over sized sliding glass door with forest view and A/C. Living room, family room and dining room. Fully fenced yard. Private and located end of street, backing up to forest lands.
For sale
Price cut: $24K (10/2)
$275,000
36882 Holly Ave, Burney, CA 96013
3beds
2,052sqft
Single Family Residence
Built in 1968
0.29 Acres Lot
$274,300 Zestimate®
$134/sqft
$-- HOA
What's special
Fully fenced yardNewer roofHigh-end convection oven
- 157 days
- 317
- 30
Zillow last checked:
Listing updated:
Listed by:
Al Naticchioni DRE #01035120 530-245-1944,
RE/MAX of Redding,
Tomas Avalos DRE #02006101 530-605-6055,
RE/MAX of Redding
Source: SMLS,MLS#: 26-2744
Facts & features
Interior
Bedrooms & bathrooms
- Bedrooms: 3
- Bathrooms: 2
- Full bathrooms: 1
- 1/2 bathrooms: 1
Heating
- Forced Air
Cooling
- Other
Features
- Flooring: Wood, Vinyl, Wall to Wall Carpet
- Windows: Skylight(s)
- Has basement: No
Interior area
- Total structure area: 2,052
- Total interior livable area: 2,052 sqft
Property
Parking
- Parking features: Off Street
Features
- Levels: One
- Pool features: None
- Has view: Yes
Lot
- Size: 0.29 Acres
- Features: Level, City Lot
Details
- Parcel number: 028130004000
Construction
Type & style
- Home type: SingleFamily
- Architectural style: Ranch
- Property subtype: Single Family Residence
Materials
- Wood Siding
- Foundation: Raised
- Roof: Composition
Condition
- Year built: 1968
Utilities & green energy
- Electric: Public
- Sewer: Sewer
- Water: Public
Community & HOA
HOA
- Has HOA: No
Location
- Region: Burney
Financial & listing details
- Price per square foot: $134/sqft
- Tax assessed value: $208,907
- Date on market: 6/5/2026
- Listing terms: All Cash to Seller,FHA/VA
- Electric utility on property: Yes
- Road surface type: Asphalt
Estimated market value
$274,300
$261,000 - $288,000
$2,321/mo
Price history
| Date | Event | Price |
|---|---|---|
| 10/2/2026 | Price change | $275,000-8%$134/sqft |
Source:  SMLS #26-2744 Report a problem | ||
| 8/21/2026 | Price change | $299,000-6.3%$146/sqft |
Source: SMLS #26-2744 Report a problem | ||
| 7/28/2026 | Price change | $319,000-3.3%$155/sqft |
Source: SMLS #26-2744 Report a problem | ||
| 6/5/2026 | Listed for sale | $329,900+3.4%$161/sqft |
Source: SMLS #26-2744 Report a problem | ||
| 4/21/2026 | Listing removed | $319,000$155/sqft |
Source: SMLS #25-4779 Report a problem | ||
| 2/11/2026 | Price change | $319,000-3%$155/sqft |
Source: SMLS #25-4779 Report a problem | ||
| 11/18/2025 | Price change | $329,000-6%$160/sqft |
Source: SMLS #25-4779 Report a problem | ||
| 10/22/2025 | Listed for sale | $350,000+81.3%$171/sqft |
Source: SMLS #25-4779 Report a problem | ||
| 6/15/2022 | Sold | $193,000-1%$94/sqft |
Source: SMLS #20-2407 Report a problem | ||
| 11/16/2021 | Listed for sale | $195,000-11%$95/sqft |
Source: SMLS #20-2407 Report a problem | ||
| 10/18/2021 | Listing removed | -- |
Source: SMLS Report a problem | ||
| 8/24/2021 | Price change | $219,000-4.4%$107/sqft |
Source: SMLS #20-6023 Report a problem | ||
| 7/30/2021 | Price change | $229,000-14.9%$112/sqft |
Source: SMLS #20-6023 Report a problem | ||
| 6/26/2021 | Listed for sale | $269,000+37.9%$131/sqft |
Source: SMLS #20-6023 Report a problem | ||
| 1/11/2021 | Listing removed | -- |
Source: SMLS Report a problem | ||
| 1/6/2021 | Listed for sale | $195,000-2%$95/sqft |
Source: HIGH COUNTRY REAL ESTATE #20-2407 Report a problem | ||
| 11/6/2020 | Listing removed | $199,000$97/sqft |
Source: HIGH COUNTRY REAL ESTATE #20-2407 Report a problem | ||
| 7/21/2020 | Price change | $199,000-2.9%$97/sqft |
Source: HIGH COUNTRY REAL ESTATE #20-2407 Report a problem | ||
| 7/3/2020 | Price change | $205,000-2.4%$100/sqft |
Source: HIGH COUNTRY REAL ESTATE #20-2407 Report a problem | ||
| 5/18/2020 | Listed for sale | $210,000+8.5%$102/sqft |
Source: HIGH COUNTRY REAL ESTATE #20-2407 Report a problem | ||
| 6/12/2012 | Sold | $193,500-7.8%$94/sqft |
Source: SMLS #11-2861 Report a problem | ||
| 1/30/2011 | Listing removed | $209,900$102/sqft |
Source: Century 21 Big PInes Realty #10-566 Report a problem | ||
| 9/30/2010 | Listed for sale | $209,900$102/sqft |
Source: Century 21 Big PInes Realty #10-566 Report a problem | ||
Public tax history
| Year | Property taxes | Tax assessment |
|---|---|---|
| 2026 | -- | $208,907 +2% |
| 2025 | $2,205 +5.5% | $204,812 +2% |
| 2024 | $2,090 +1.4% | $200,797 +2% |
| 2023 | $2,060 -16.3% | $196,860 -14% |
| 2022 | $2,462 +5.6% | $229,019 +2% |
| 2021 | $2,332 +0.3% | $224,529 +1% |
| 2020 | $2,324 +4.2% | $222,228 +2% |
| 2019 | $2,231 +0.6% | $217,872 +0.6% |
| 2018 | $2,217 -0.6% | $216,601 +2% |
| 2017 | $2,231 +4.7% | $212,414 +3.5% |
| 2016 | $2,132 +2.1% | $205,309 +1.5% |
| 2015 | $2,088 | $202,226 |
Find assessor info on the county website
Monthly payment
Est. payment
Payment breakdown
Explore the cost of this home by adjusting the details. Changes won't be saved.Climate risks
Neighborhood: 96013

Similar homes
- $259,0003 bd2 ba1.5k sqft20211 Arrowood St, Burney, CA 96013For Sale
 MLS ID #26-4454, Allison Cassity. SMLS
- $292,0003 bd2 ba1.3k sqft20251 Marquette St, Burney, CA 96013For Sale
 MLS ID #26-2950, Drew Wahlund. SMLS
- $299,0003 bd2 ba1.8k sqft20607 Burney Ct, Burney, CA 96013For Sale
 MLS ID #25-2922, Cory Halter. SMLS
- $289,0003 bd3 ba1.9k sqft20394 Camas Rd, Burney, CA 96013For Sale
 MLS ID #25-313, Cory Halter. SMLS
