Work is needed, but the potential rewards are well worth it in this two-family home. A fantastic opportunity to live in one unit while renovating the other, or to add value as an investment property. One unit offers 2 bedrooms, while the second features 3 bedrooms, providing flexible living and rental options. Conveniently located close to highways and shopping, this property is ideal for owner-occupants or investors looking for a value-add opportunity. Property is a land lease. DEED RESTRICTIONS REQUIRE OWNER OCCUPANTS ONLY
Under contract
$220,000
37-39 Graham Road, East Hartford, CT 06118
5beds
2,280sqft
Multi Family
Built in 1968
-- sqft lot
$218,900 Zestimate®
$96/sqft
$-- HOA
What's special
- 44 days
- 2,617
- 137
Zillow last checked:
Listing updated:
Listed by:
Lisa Sader (860)526-3598,
Aspen Realty Group 860-337-0011
Source: Smart MLS,MLS#: 24207704
Facts & features
Interior
Bedrooms & bathrooms
- Bedrooms: 5
- Bathrooms: 4
- Full bathrooms: 2
- 1/2 bathrooms: 2
Heating
- Hot Water, Natural Gas
Cooling
- None
Features
- Basement: Full
- Attic: None
- Has fireplace: No
Interior area
- Total structure area: 2,280
- Total interior livable area: 2,280 sqft
- Finished area above ground: 2,280
Property
Lot
- Size: 435 Square Feet
Details
- Parcel number: 2282922
- Zoning: R-4
- Special conditions: Real Estate Owned
Construction
Type & style
- Home type: MultiFamily
- Architectural style: Units are Side-by-Side
- Property subtype: Multi Family
- Attached to another structure: Yes
Materials
- Aluminum Siding
- Foundation: Concrete Perimeter
- Roof: Asphalt
Condition
- New construction: No
- Year built: 1968
Utilities & green energy
- Sewer: Public Sewer
- Water: Public
Community & HOA
HOA
- Has HOA: No
Location
- Region: East Hartford
Financial & listing details
- Price per square foot: $96/sqft
- Tax assessed value: $135,310
- Annual tax amount: $6,392
- Date on market: 9/17/2026
Foreclosure details
Estimated market value
$218,900
$208,000 - $230,000
$2,452/mo
Price history
| Date | Event | Price |
|---|---|---|
| 12/16/2023 | Listing removed | $135,000$59/sqft |
Source:  NextHome #170584742 Report a problem | ||
| 11/4/2023 | Listed for sale | $135,000$59/sqft |
Source: NextHome #170584742 Report a problem | ||
| 10/17/2023 | Listing removed | -- |
Source: NextHome Report a problem | ||
| 8/1/2023 | Pending sale | $135,000$59/sqft |
Source: NextHome #170584742 Report a problem | ||
| 7/15/2023 | Listed for sale | $135,000-25%$59/sqft |
Source: NextHome #170584742 Report a problem | ||
| 6/13/2006 | Sold | $180,000+80%$79/sqft |
Source: Public Record Report a problem | ||
| 1/29/2003 | Sold | $100,000+3.1%$44/sqft |
Source: Public Record Report a problem | ||
| 12/12/1994 | Sold | $97,000$43/sqft |
Source: Public Record Report a problem | ||
Public tax history
| Year | Property taxes | Tax assessment |
|---|---|---|
| 2025 | $6,211 +4.3% | $135,310 |
| 2024 | $5,954 +3.4% | $135,310 |
| 2023 | $5,756 +3.7% | $135,310 |
| 2022 | $5,548 +8.2% | $135,310 +30.2% |
| 2021 | $5,127 -1.2% | $103,900 |
| 2020 | $5,187 +1.6% | $103,900 |
| 2019 | $5,103 +3% | $103,900 |
| 2018 | $4,952 +1.3% | $103,900 |
| 2017 | $4,888 +17.1% | $103,900 +14.2% |
| 2015 | $4,173 +1% | $90,990 |
| 2014 | $4,131 +3.4% | $90,990 |
| 2013 | $3,994 +2.6% | $90,990 |
| 2012 | $3,893 -11.5% | $90,990 -28.8% |
| 2011 | $4,398 +1.8% | $127,770 |
| 2010 | $4,321 +6.8% | $127,770 |
| 2009 | $4,046 | $127,770 |
| 2008 | $4,046 -12.3% | $127,770 |
| 2007 | $4,615 | $127,770 |
Find assessor info on the county website
Monthly payment
Climate risks
Neighborhood: 06118
Similar homes
- $240,0004 bd3 ba2.3k sqft356 Wethersfield Avenue, Hartford, CT 06114For Sale

 MLS ID #24189200, Karen Bell, LPT Realty. Smart MLS
- $269,9003 bd2 ba1.2k sqft33 Hilton Drive, East Hartford, CT 06118For Sale
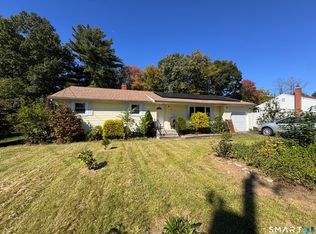 MLS ID #24212130, Michael J. Johnson, Lock and Key Realty, Inc. Smart MLS
- $249,9006 bd2 ba2.4k sqft387 North Main Street, Manchester, CT 06042For Sale
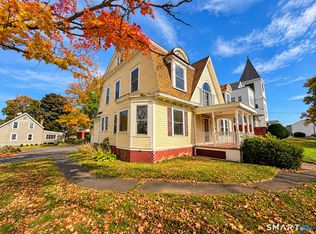 MLS ID #24216277, Kamil Andrukiewicz, New Haus Group LLC. Smart MLS
- $119,0007 bd3 ba2k sqft9 Whiting Road, East Hartford, CT 06118For Sale
 MLS ID #24214650, Thomas Mele, Social & Co Realty. Smart MLS
- $239,9002 bd2 ba1.5k sqft41 Bissell Street, East Hartford, CT 06108For SaleMLS ID #24211317, Anthony La Penna, Exceptional Real Estate LLC. Smart MLS
- $320,0003 bd2 ba1.4k sqft11 Brewer Street, East Hartford, CT 06118For SaleMLS ID #24214955, Christopher Ragsdale, Thomas Real Estate. Smart MLS
- $240,0004 bd3 ba2.3k sqftSouth Meadow Estates, Hartford, CT 06114For SaleMLS ID #24188401, Karen Bell, LPT Realty. Smart MLS
- $300,0003 bd2 ba1.6k sqft1026 Forbes Street, East Hartford, CT 06118For SaleMLS ID #24207955, Dan Beirne, Opendoor Brokerage LLC. Smart MLS
- $249,9253 bd2 ba1.4k sqft143 Rockville Road, East Windsor, CT 06016For SaleMLS ID #24218101, Maria Pirulli, Five Stars Realty. Smart MLS
- $250,0006 bd2 ba2.5k sqft2 Nooks Hill Road, Cromwell, CT 06416For SaleMLS ID #24214704, Anthony La Penna, Exceptional Real Estate LLC. Smart MLS
- $224,9002 bd2 ba1.3k sqftEl Dorado Residences, Hartford, CT 06114For SaleMLS ID #24203689, Rob F. Rosa, Berkshire Hathaway NE Prop.. Smart MLS
- $319,9003 bd2 ba1.3k sqft159 Lydall Road, East Hartford, CT 06118For SaleMLS ID #24212421, Andrew Hirth, Berkshire Hathaway NE Prop.. Smart MLS
- $264,9003 bd1 ba1.3k sqft822 Tolland Street, East Hartford, CT 06108For SaleMLS ID #24213040, David J. Lemkuil, Shimkus, Murphy & Lemkuil. Smart MLS
- $323,5003 bd2 ba1.6k sqft26 Scarborough Road, Windsor, CT 06095For SaleMLS ID #24211459, Kara A. Mazzola, First Choice Realty. Smart MLS
- $225,0002 bd2 ba1.3k sqftRockridge, Mansfield, CT 06268For SaleMLS ID #24217607, Peter Meng, William Raveis Real Estate. Smart MLS
- $310,0006 bd2 ba2.8k sqft39-41 Putnam Street, Hartford, CT 06106For SaleMLS ID #24127521, Natalie J. Mullings, Douglas & Tinker Realty. Smart MLS
- $249,9003 bd2 ba1.5k sqft506 Center Street, Manchester, CT 06040For SaleMLS ID #24204337, Michael D. Long, Roundtree Realty LLC. Smart MLS
- $259,0005 bd2 ba1.8k sqft309 Chestnut Street, New Britain, CT 06051For SaleMLS ID #24203409, Meagan Albert, Tier 1 Real Estate. Smart MLS
- $189,9002 bd3 ba1.3k sqftBeaman Brook, Bloomfield, CT 06002For SaleMLS ID #24206591, Jenn Buxton, Serhant Connecticut, LLC. Smart MLS
