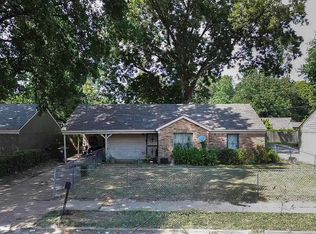
Great home ready for your personal touches. Affordable starter home or great investment property. **Property being sold in as-is condition.
Pending
$90,000
3739 Wickcliff Ln, Memphis, TN 38118
3beds
1,158sqft
Single Family Residence
Built in 1952
10,018 Square Feet Lot
$-- Zestimate®
$78/sqft
$-- HOA
What's special
- 49 days
- 52
- 7
Zillow last checked:
Listing updated:
Listed by:
Nathan L Gray,
REI Nation Real Estate Service 901-751-7979
Source: MAAR,MLS#: 10230940
Facts & features
Interior
Bedrooms & bathrooms
- Bedrooms: 3
- Bathrooms: 1
- Full bathrooms: 1
Heating
- Other (See REMARKS)
Cooling
- Other (See REMARKS)
Features
- Other (See Remarks), Square Feet Source: AutoFill (MAARdata) or Public Records (Cnty Assessor Site)
- Has fireplace: No
Interior area
- Total interior livable area: 1,158 sqft
Property
Parking
- Total spaces: 1
- Parking features: Other (See REMARKS)
- Covered spaces: 1
Features
- Stories: 1
- Exterior features: Other (See REMARKS)
- Pool features: None
Lot
- Size: 10,018 Square Feet
- Dimensions: 70 x 145
- Features: Other (See Remarks)
Details
- Parcel number: 060196 00008
Construction
Type & style
- Home type: SingleFamily
- Architectural style: Other (See Remarks)
- Property subtype: Single Family Residence
Condition
- New construction: No
- Year built: 1952
Community & HOA
Community
- Subdivision: Kensington Gardens Blk D
Location
- Region: Memphis
Financial & listing details
- Price per square foot: $78/sqft
- Tax assessed value: $96,600
- Annual tax amount: $1,273
- Price range: $90K - $90K
- Date on market: 9/23/2026
- Cumulative days on market: 20 days
Estimated market value
Not available
Estimated sales range
Not available
$1,200/mo
Price history
| Date | Event | Price |
|---|---|---|
| 11/10/2026 | Pending sale | $90,000$78/sqft |
Source:  MAAR #10230940 Report a problem | ||
| 10/28/2026 | Listed for sale | $90,000$78/sqft |
Source: MAAR #10230940 Report a problem | ||
| 9/29/2026 | Pending sale | $90,000$78/sqft |
Source: MAAR #10230940 Report a problem | ||
| 9/23/2026 | Listed for sale | $90,000+91.9%$78/sqft |
Source: MAAR #10230940 Report a problem | ||
| 10/12/2019 | Listing removed | $750$1/sqft |
Source: Premier Property Management Group Report a problem | ||
| 10/10/2019 | Price change | $750-5.7%$1/sqft |
Source: Premier Property Management Group Report a problem | ||
| 9/12/2019 | Price change | $795-0.6%$1/sqft |
Source: Premier Property Management Group Report a problem | ||
| 9/4/2019 | Listed for rent | $800$1/sqft |
Source: Premier Property Management Group Report a problem | ||
| 7/21/2018 | Listing removed | $800$1/sqft |
Source: Premier Property Management Group Report a problem | ||
| 6/16/2018 | Listed for rent | $800+6.7%$1/sqft |
Source: Zillow Rental Manager Report a problem | ||
| 6/24/2015 | Listing removed | $750$1/sqft |
Source: Premier Property Management Report a problem | ||
| 3/23/2015 | Listed for rent | $750+11.1%$1/sqft |
Source: First Choice Report a problem | ||
| 11/10/2011 | Listing removed | $675$1/sqft |
Source: My Rental Properties Report a problem | ||
| 11/5/2011 | Listed for rent | $675$1/sqft |
Source: My Rental Properties Report a problem | ||
| 11/17/2009 | Sold | $46,900+56.3%$41/sqft |
Source: Public Record Report a problem | ||
| 2/23/2009 | Sold | $30,000+15.8%$26/sqft |
Source: Public Record Report a problem | ||
| 1/21/2009 | Sold | $25,900-0.4%$22/sqft |
Source: Public Record Report a problem | ||
| 11/28/2008 | Listed for sale | $26,000-60.9%$22/sqft |
Source: foreclosure.com Report a problem | ||
| 4/3/2000 | Sold | $66,500$57/sqft |
Source: Public Record Report a problem | ||
Public tax history
| Year | Property taxes | Tax assessment |
|---|---|---|
| 2025 | $1,273 +7.4% | $24,150 +34.2% |
| 2024 | $1,185 +8.1% | $18,000 |
| 2023 | $1,097 | $18,000 |
| 2022 | -- | $18,000 |
| 2021 | -- | $18,000 +33.3% |
| 2020 | $431 | $13,500 |
| 2019 | $431 -21.1% | $13,500 |
| 2018 | $547 -45.1% | $13,500 |
| 2017 | $996 +125.9% | $13,500 +4% |
| 2016 | $441 -15.3% | $12,975 |
| 2014 | $521 | $12,975 |
| 2013 | -- | $12,975 -20.5% |
| 2012 | -- | $16,325 |
| 2011 | -- | $16,325 |
| 2010 | -- | $16,325 |
| 2009 | -- | $16,325 -6% |
| 2008 | -- | $17,375 |
| 2007 | -- | $17,375 |
| 2006 | -- | $17,375 |
| 2005 | -- | $17,375 +10.3% |
| 2004 | -- | $15,750 |
| 2003 | -- | $15,750 |
| 2002 | -- | $15,750 |
| 2001 | -- | $15,750 +25.5% |
| 2000 | -- | $12,550 |
Find assessor info on the county website
Monthly payment
Est. payment
Payment breakdown
Explore the cost of this home by adjusting the details. Changes won't be saved.Climate risks
Neighborhood: Parkway Village-Oakhaven

Similar homes
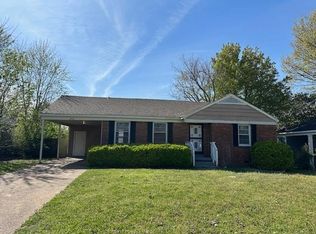
- $--3 bd2 ba903 sqft4719 Lofts Rd, Memphis, TN 38118Auction
 Auction.com 2
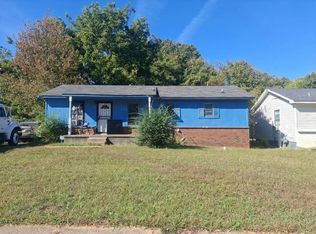
- $99,9003 bd1 ba913 sqft4095 Kenosha Rd, Memphis, TN 38118For Sale
 MLS ID #10233971, Dean Harris, CrestCore Realty MphsBrokerage. MAAR
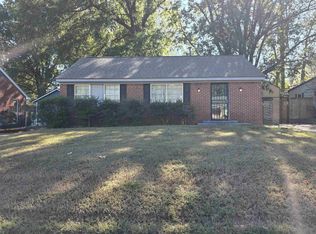
- $--3 bd2 ba1.2k sqft4268 Knight Arnold Rd, Memphis, TN 38118Auction
 Auction.com 2
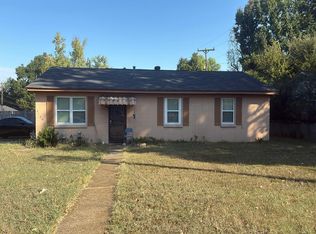
- $90,0003 bd2 ba1.1k sqft4040 Knight Arnold Rd, Memphis, TN 38118For Sale
 MLS ID #10228996, Caleb Parr, Renshaw Company, REALTORS. MAAR
