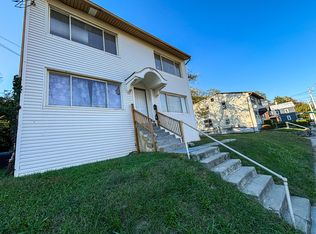
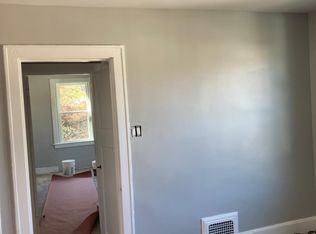
Cash flowing duplex in a prime location with quick access to UC, the hospital networks, and downtown. Unit 1 is rented for $1,700 a month, Unit 2 just got freshly renovated and is actively leasing for $1,800 a month. Total cash flow will be $3,500 a month! Both units are 4bd2ba, utilities are already split, owner pays water-Major items updated or newer: front/rear siding, front door, most windows, hvac, water heaters, paint, and flooring. Seller is moving out of town and does not wish to manage remotely - now's your chance to snap up this gem and add to your portfolio. *MUST GIVE 24 HR NOTICE FOR SHOWINGS
For sale
$300,000
3835 Vine St, Cincinnati, OH 45217
8beds
2,700sqft
Multi Family, Duplex
Built in 1926
-- sqft lot
$-- Zestimate®
$111/sqft
$-- HOA
What's special
Most windowsWater heaters
- 12 days
- 313
- 41
Zillow last checked:
Listing updated:
Listed by:
Corey Zamrik 480-307-7780,
HHG Realty Services, LLC 859-444-0180
Source: Cincy MLS,MLS#: 1898483 Originating MLS: Cincinnati Area Multiple Listing Service
Facts & features
Interior
Bedrooms & bathrooms
- Bedrooms: 8
- Bathrooms: 4
- Full bathrooms: 4
Heating
- Gas
Cooling
- Central Air, Separate Air Conditioning
Features
- Windows: Vinyl, Insulated Windows
- Basement: Full
- Has fireplace: No
- Fireplace features: None
Interior area
- Total structure area: 2,700
- Total interior livable area: 2,700 sqft
Property
Parking
- Parking features: Off Street
Features
- Levels: Two
- Stories: 2
Lot
- Size: 4,007 Square Feet
Details
- Parcel number: 2180055002400
Construction
Type & style
- Home type: MultiFamily
- Property subtype: Multi Family, Duplex
Materials
- Vinyl Siding
- Foundation: Block
- Roof: Shingle
Condition
- New construction: No
- Year built: 1926
Utilities & green energy
- Gas: Natural
- Sewer: Public Sewer
- Water: Public
Community & HOA
Location
- Region: Cincinnati
Financial & listing details
- Price per square foot: $111/sqft
- Tax assessed value: $23
- Annual tax amount: $1,466
- Date on market: 10/27/2026
- Listing terms: No Special Financing
- Total actual rent: 3500
- Tenant pays: Heat
Estimated market value
Not available
Estimated sales range
Not available
Not available
Price history
| Date | Event | Price |
|---|---|---|
| 10/28/2026 | Listed for sale | $300,000+5.6%$111/sqft |
Source:  Cincy MLS #1898483 Report a problem | ||
| 4/15/2026 | Listing removed | $284,000$105/sqft |
Source: Cincy MLS #1870581 Report a problem | ||
| 4/8/2026 | Price change | $284,000-1.7%$105/sqft |
Source: Cincy MLS #1870581 Report a problem | ||
| 3/31/2026 | Price change | $289,000-2%$107/sqft |
Source: Cincy MLS #1870581 Report a problem | ||
| 3/23/2026 | Price change | $295,000-1.7%$109/sqft |
Source: Cincy MLS #1870581 Report a problem | ||
| 3/7/2026 | Listed for sale | $300,000-4.8%$111/sqft |
Source: Cincy MLS #1870581 Report a problem | ||
| 12/19/2025 | Listing removed | $315,000$117/sqft |
Source: Cincy MLS #1862400 Report a problem | ||
| 12/1/2025 | Price change | $315,000-3.1%$117/sqft |
Source: Cincy MLS #1862400 Report a problem | ||
| 11/22/2025 | Listed for sale | $325,000+32.7%$120/sqft |
Source: Cincy MLS #1862400 Report a problem | ||
| 12/5/2024 | Sold | $245,000-2%$91/sqft |
Source: Cincy MLS #1822026 Report a problem | ||
| 10/29/2024 | Pending sale | $249,999$93/sqft |
Source: Cincy MLS #1822026 Report a problem | ||
| 10/18/2024 | Listed for sale | $249,999-3.5%$93/sqft |
Source: Cincy MLS #1822026 Report a problem | ||
| 6/5/2024 | Listing removed | -- |
Source: Cincy MLS #1801425 Report a problem | ||
| 4/19/2024 | Listed for sale | $259,000$96/sqft |
Source: Cincy MLS #1801425 Report a problem | ||
| 4/12/2024 | Pending sale | $259,000$96/sqft |
Source: Cincy MLS #1801425 Report a problem | ||
| 4/10/2024 | Listed for sale | $259,000+621.4%$96/sqft |
Source: Cincy MLS #1801425 Report a problem | ||
| 4/15/2020 | Listing removed | -- |
Source: Auction.com Report a problem | ||
| 3/10/2020 | Listed for sale | -- |
Source: Auction.com Report a problem | ||
| 10/27/2004 | Sold | $35,900+19.7%$13/sqft |
Source: Cincy MLS #903132 Report a problem | ||
| 8/9/2004 | Sold | $30,000-45.4%$11/sqft |
Source: Public Record Report a problem | ||
| 5/24/2001 | Sold | $54,900$20/sqft |
Source: Public Record Report a problem | ||
| 3/19/2001 | Sold | $54,900$20/sqft |
Source: Cincy MLS #728209 Report a problem | ||
Public tax history
| Year | Property taxes | Tax assessment |
|---|---|---|
| 2025 | $1,516 +0.1% | $23,769 |
| 2024 | $1,514 -0.2% | $23,769 |
| 2023 | $1,517 +15.2% | $23,769 +28.2% |
| 2022 | $1,317 -18% | $18,540 |
| 2021 | $1,607 | $18,540 |
| 2020 | $1,607 +20.7% | $18,540 +7% |
| 2019 | $1,331 +6.8% | $17,328 0% |
| 2018 | $1,245 | $17,329 |
| 2017 | $1,245 +10.9% | $17,329 +1.6% |
| 2016 | $1,123 | $17,056 |
| 2015 | $1,123 -0.6% | $17,056 |
| 2014 | $1,130 -63.6% | $17,056 -52.2% |
| 2013 | $3,108 +1.6% | $35,718 |
| 2012 | $3,060 +29.4% | $35,718 +26.4% |
| 2011 | $2,365 +13% | $28,259 +7.6% |
| 2010 | $2,094 +3.8% | $26,275 |
| 2009 | $2,017 +1.9% | $26,275 |
| 2008 | $1,980 +14.1% | $26,275 +2% |
| 2007 | $1,736 +1% | $25,760 |
| 2006 | $1,719 -0.8% | $25,760 |
| 2005 | $1,732 +4.1% | $25,760 -0.7% |
| 2003 | $1,663 +6.4% | $25,935 |
| 2002 | $1,563 +3.8% | $25,935 +7.9% |
| 2001 | $1,506 +2.7% | $24,045 |
| 2000 | $1,467 | $24,045 |
Find assessor info on the county website
Monthly payment
Est. payment
Payment breakdown
Explore the cost of this home by adjusting the details. Changes won't be saved.Climate risks
Neighborhood: Clifton

Similar homes
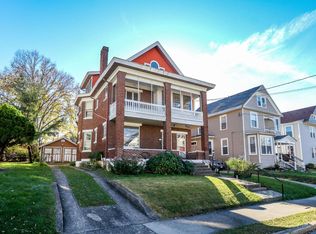
- $300,0005 bd2 ba2.4k sqft1945 Hudson Ave, Cincinnati, OH 45212For Sale
 MLS ID #1898968, Tabatha L Hamilton, eXp Realty. Cincy MLS
- $260,0007 bd-- ba3.7k sqft811 S Fred Shuttlesworth Cir, Cincinnati, OH 45229For Sale
 MLS ID #1899402, Mark McGrath, Home Information Network, Inc.. Cincy MLS
- $349,9007 bd4 ba3.7k sqft3636 Reading Rd, Cincinnati, OH 45229For Sale
 MLS ID #1889980, Ali Abdur-Rahman, Plum Tree Realty. Cincy MLS
- $320,0006 bd4 ba3.3k sqft5855 Monfort Hills Ave, Cincinnati, OH 45239For Sale
 MLS ID #1899664, Chau Phung, OwnerLand Realty, Inc.. Cincy MLS
- $339,9005 bd2 ba2.4k sqft462 Dayton St, Cincinnati, OH 45214For SaleMLS ID #1874609, Troy Kutcha, Plum Tree Realty. Cincy MLS
- $349,9006 bd4 ba3k sqft2477 Westwood Northern Blvd, Cincinnati, OH 45211For SaleMLS ID #1897057, Rick J Finn, Coldwell Banker Realty. Cincy MLS
- $420,0006 bd3 ba2.1k sqft206 Oak St, Cincinnati, OH 45219For SaleMLS ID #1899261, Christian Salazar, Comey & Shepherd. Cincy MLS
- $334,9006 bd2 ba1.7k sqft5538 Montgomery Rd, Cincinnati, OH 45212For SaleMLS ID #1888580, Daniel Baron, Keller Williams Advisors. Cincy MLS
- $250,0005 bd3 ba2.5k sqft2200 Lawn Ave, Cincinnati, OH 45212For SaleMLS ID #1896555, Kyle Sticklen, Sibcy Cline, Inc.. Cincy MLS
- $325,0006 bd4 ba1.6k sqft7131 Eastlawn, Cincinnati, OH 45237For SaleMLS ID #1892267, William S Reed, Keller Williams Seven Hills Re. Cincy MLS
- $187,5005 bd2 ba2.5k sqft3320 Glenway Ave, Cincinnati, OH 45205For SaleMLS ID #1899284, Jennifer L Day, RE/MAX Preferred Group. Cincy MLS
- $329,0005 bd3 ba2.3k sqft3257 Daytona Ave, Cincinnati, OH 45211For SaleMLS ID #1896487, Beverly K Pearson, Plum Tree Realty. Cincy MLS
- $450,0005 bd2 ba2k sqft223 Emming St, Cincinnati, OH 45219For SaleMLS ID #1899266, Christian Salazar, Comey & Shepherd. Cincy MLS
- $299,9006 bd2 ba2.2k sqft2361 Highland Ave, Cincinnati, OH 45212For SaleMLS ID #1893804, Jeffrey J Asquith, Keller Williams Advisors. Cincy MLS
- $185,0005 bd2 ba2.1k sqft2117 Saint Leo Pl, Cincinnati, OH 45211For SaleMLS ID #1898636, Jennifer Vonderbrink, Redfin. Cincy MLS
- $350,0006 bd4 ba3.4k sqft3118 Werk Rd, Cincinnati, OH 45211For SaleMLS ID #1889537, Jonathan M Hardy, Keller Williams Seven Hills Re. Cincy MLS
- $240,0006 bd4 ba3.9k sqft2137 Colerain Ave, Cincinnati, OH 45214For SaleMLS ID #1896709, Alicia J Stoughton, Keller Williams Advisors. Cincy MLS
- $419,9007 bd3 ba3.4k sqft3543 Wilson Ave, Cincinnati, OH 45229For SaleMLS ID #1872821, Wendy Furbay, Coldwell Banker Realty. Cincy MLS
- $270,0005 bd2 ba1.8k sqft238 Helen St, Cincinnati, OH 45219For SaleMLS ID #1872683, Julie Rose, Coldwell Banker Realty. Cincy MLS
- $325,0005 bd2 ba1.4k sqft3011 Riddle View Ln, Cincinnati, OH 45220For SaleMLS ID #1893625, Garrick M. Horton, Comey & Shepherd. Cincy MLS
