Seconsett Island sweet 3 BR/1bath ranch home ready for your imagination! This home was lived in year-round. for many years. All real hardwood flooring throughout. Nice level lot. Seller will provide septic inspection and engineering if required. Buyer will assume septic replacement if necessary. walk to beach and boating.
For sale
$849,000
39 Bayview Road, Mashpee, MA 02649
3beds
1,040sqft
Single Family Residence
Built in 1972
0.25 Acres Lot
$811,700 Zestimate®
$816/sqft
$-- HOA
What's special
Real hardwood flooring throughoutNice level lot
- 4 days
- 494
- 36
Zillow last checked:
Listing updated:
Listed by:
Priscilla A Stolba 508-989-1943,
Priscilla Stolba R E
Source: CCIMLS,MLS#: 22605422
Facts & features
Interior
Bedrooms & bathrooms
- Bedrooms: 3
- Bathrooms: 1
- Full bathrooms: 1
Heating
- Natural Gas
Cooling
- None
Appliances
- Included: Natural Gas, Water Heater
- Laundry: Electric Dryer Hookup, Washer Hookup
Features
- Attic Storage, Linen Closet
- Flooring: Hardwood, Vinyl
- Basement: Full
Interior area
- Total structure area: 1,040
- Total interior livable area: 1,040 sqft
Property
Parking
- Total spaces: 3
- Parking features: Driveway
- Has uncovered spaces: Yes
Features
- Stories: 1
- Waterfront features: Waterview
Lot
- Size: 0.25 Acres
- Features: Interior Lot, Level
Details
- Parcel number: MASH M:119 B: L:1300
- Special conditions: None
Construction
Type & style
- Home type: SingleFamily
- Property subtype: Single Family Residence
Materials
- Shingle Siding
- Roof: Asphalt,Pitched
Condition
- Year built: 1972
Utilities & green energy
- Water: Public
Community & HOA
Community
- Features: Conservation Area
HOA
- Has HOA: No
- Amenities included: Beach Access, Common Area
Location
- Region: Mashpee
Financial & listing details
- Price per square foot: $816/sqft
- Tax assessed value: $607,400
- Annual tax amount: $4,045
- Date on market: 10/25/2026
- Cumulative days on market: 5 days
Estimated market value
$811,700
$771,000 - $852,000
$2,955/mo
Price history
| Date | Event | Price |
|---|---|---|
| 10/25/2026 | Listed for sale | $849,000$816/sqft |
Source:  CCIMLS #22605422 Report a problem | ||
Public tax history
| Year | Property taxes | Tax assessment |
|---|---|---|
| 2025 | $3,795 +11.2% | $573,300 +8% |
| 2024 | $3,412 +7.7% | $530,600 +17.4% |
| 2023 | $3,168 +4.8% | $451,900 +22.2% |
| 2022 | $3,022 +2.8% | $369,900 +14.1% |
| 2021 | $2,940 +3.7% | $324,200 +4% |
| 2020 | $2,834 -2.3% | $311,800 -2.7% |
| 2019 | $2,901 +6.3% | $320,600 +4.8% |
| 2018 | $2,728 +0.1% | $305,800 +3.1% |
| 2017 | $2,725 +1.3% | $296,500 +1.9% |
| 2016 | $2,689 +2.5% | $291,000 +1% |
| 2015 | $2,624 +10.5% | $288,000 +13.9% |
| 2014 | $2,375 +1.4% | $252,900 +0.2% |
| 2013 | $2,343 -5.6% | $252,500 -8.9% |
| 2012 | $2,483 +1.1% | $277,100 -0.4% |
| 2011 | $2,456 +12.9% | $278,100 -0.4% |
| 2010 | $2,175 +7.5% | $279,200 -3.5% |
| 2009 | $2,023 +2.6% | $289,400 -3.4% |
| 2008 | $1,971 +2.6% | $299,600 -8.9% |
| 2007 | $1,921 +2.6% | $328,900 +17.4% |
| 2006 | $1,872 +9.9% | $280,200 +6.8% |
| 2005 | $1,703 +10.6% | $262,400 +66% |
| 2004 | $1,540 +2.4% | $158,100 |
| 2003 | $1,504 +6.9% | $158,100 |
| 2002 | $1,407 +3.3% | $158,100 +57.6% |
| 2001 | $1,362 | $100,300 |
Find assessor info on the county website
Monthly payment
Est. payment
Payment breakdown
Explore the cost of this home by adjusting the details. Changes won't be saved.Climate risks
Neighborhood: 02649
Similar homes
- $874,9003 bd2 ba1.3k sqft138 Sippewissett Road, Falmouth, MA 02540For Sale
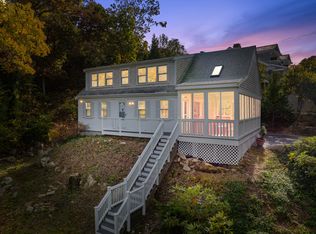
 MLS ID #22605468, Alan R Porretti, William Raveis Real Estate & Home Services. CCIMLS
- $795,0003 bd2 ba1.3k sqft35 Pequot Road, Mashpee, MA 02649For Sale
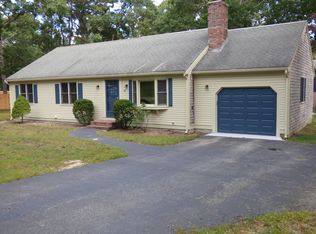 MLS ID #22604858, Brian G Cobb, CRS, Kinlin Grover Compass. CCIMLS
- $650,0002 bd2 ba1.1k sqft203 Monomoscoy Road, Mashpee, MA 02649For Sale
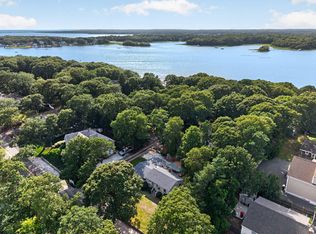 MLS ID #22603819, Pamela Heylin, Berkshire Hathaway HomeServices Robert Paul Properties. CCIMLS
- $775,0002 bd2 ba985 sqft28 Flying Cloud Cir, Mashpee, MA 02649For Sale
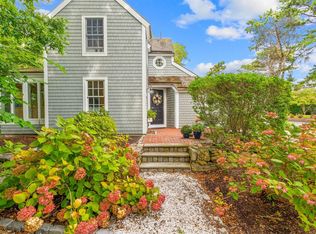 MLS ID #73581765, Dorothy Oosterman, New Seabury Sotheby's International Realty. MLS PIN
- $899,0003 bd2 ba1.3k sqft666 Santuit Rd, Cotuit, MA 02635For SaleMLS ID #22605229, Nick Hanney, eXp Realty, LLC. CCIMLS
- $520,0003 bd1 ba1.1k sqft21 Nohono Road, Mashpee, MA 02649For SaleMLS ID #22605267, Sheri L DePietro, Today Real Estate. CCIMLS
- $699,0003 bd2 ba1.4k sqft20 Mutiny Way, Mashpee, MA 02649For SaleMLS ID #22505707, Amanda S Clark, Cape Cod Realty Advisors. CCIMLS
- $850,0002 bd1 ba980 sqft14 Lorraine Road, East Falmouth, MA 02536For SaleMLS ID #22603813, David L White, OwnerEntry.com. CCIMLS
- $695,0002 bd1 ba930 sqft14 Amvets Avenue, Falmouth, MA 02540For SaleMLS ID #22604995, Susan M Lawrence, Kinlin Grover Compass. CCIMLS
- $589,9004 bd2 ba1.4k sqft17 Mohawk Road, Mashpee, MA 02649For SaleMLS ID #22604888, Priscilla A Stolba, Priscilla Stolba R E. CCIMLS
- $899,0002 bd2 ba985 sqft15 Brant Rock Road UNIT 15, Mashpee, MA 02649For SaleMLS ID #22604355, Mark A Thompson, New Seabury Sotheby's International Realty. CCIMLS
- $1,199,0003 bd2 ba860 sqft10 Wharf Avenue, Mashpee, MA 02649For SaleMLS ID #22602076, Dorothy M Oosterman, New Seabury Sotheby's International Realty. CCIMLS
- $799,0002 bd2 ba734 sqft2 Cliffside Lane UNIT 2, Mashpee, MA 02649For SaleMLS ID #22604958, Joe D Callahan, New Seabury Sotheby's International Realty. CCIMLS
- $625,0004 bd2 ba1.5k sqft85 Edgewater Drive W, Teaticket, MA 02536For SaleMLS ID #22605337, Thomas J Cullen, Cullen Real Estate & Appraisal. CCIMLS
- $775,0002 bd2 ba985 sqft28 Flying Cloud Circle UNIT 28, Mashpee, MA 02649For SaleMLS ID #22604837, Dorothy M Oosterman, New Seabury Sotheby's International Realty. CCIMLS
- $595,0003 bd3 ba1.5k sqft350 Old Barnstable Road UNIT 3A, East Falmouth, MA 02536For SaleMLS ID #22605415, Alan R Porretti, William Raveis Real Estate & Home Services. CCIMLS
- $629,9003 bd3 ba1.2k sqft14 Bramble Bush Drive, Forestdale, MA 02644For SaleMLS ID #22605317, Fabi Neves, Century 21 North East. CCIMLS
- $539,0003 bd2 ba1.1k sqft11 Regis Road, East Falmouth, MA 02536For SaleMLS ID #22605366, Megan Zottoli, Compass. CCIMLS
