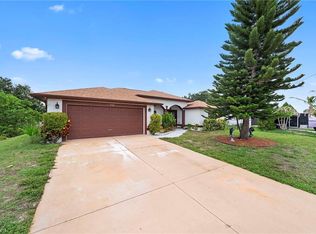
Wow! Ready to move in. 4 BR/3 BA, all full baths. Tile throughout. Make an offer today! washer and dryer are not included in sale. Possesion to take place 30 days after closing. Brokered And Advertised By: Coldwell Banker Preferred Prop Listing Agent: Ada Noste
Pre-foreclosure
Est. $326,900
3918 8th St SW, Lehigh Acres, FL 33971
4beds
3baths
2,048sqft
SingleFamily
Built in 2007
10,846 Square Feet Lot
$326,900 Zestimate®
$160/sqft
$-- HOA
Overview
- 306 days |
- 4 |
- 0 |
Facts & features
Interior
Bedrooms & bathrooms
- Bedrooms: 4
- Bathrooms: 3
Heating
- Forced air
Cooling
- Central
Features
- Flooring: Carpet
Interior area
- Total interior livable area: 2,048 sqft
Property
Parking
- Parking features: Garage - Attached
Features
- Exterior features: Stucco
Lot
- Size: 10,846 Square Feet
Details
- Parcel number: 344426L1070680140
Construction
Type & style
- Home type: SingleFamily
Materials
- Roof: Asphalt
Condition
- Year built: 2007
Community & HOA
Location
- Region: Lehigh Acres
Financial & listing details
- Price per square foot: $160/sqft
- Tax assessed value: $305,065
- Annual tax amount: $4,050
Visit our professional directory to find a foreclosure specialist in your area that can help with your home search.
Find a foreclosure agentForeclosure details
Estimated market value
$326,900
$307,000 - $347,000
$1,987/mo
Price history
| Date | Event | Price |
|---|---|---|
| 5/31/2022 | Sold | $360,000+190.3%$176/sqft |
Source: | ||
| 9/19/2013 | Sold | $124,000-0.7%$61/sqft |
Source: Public Record Report a problem | ||
| 8/24/2013 | Pending sale | $124,900$61/sqft |
Source: Coldwell Banker Preferred Prop #201329358 Report a problem | ||
| 8/15/2013 | Listed for sale | $124,900+101.5%$61/sqft |
Source: Coldwell Banker Preferred Prop #201329358 Report a problem | ||
| 12/28/2011 | Sold | $62,000$30/sqft |
Source: Public Record Report a problem | ||
| 10/26/2011 | Listed for sale | $62,000$30/sqft |
Source: isNowListed.com Report a problem | ||
| 8/19/2011 | Listing removed | $62,000$30/sqft |
Source: The Wilmoth Group Inc #201111956 Report a problem | ||
| 8/15/2011 | Price change | $62,000+24%$30/sqft |
Source: The Wilmoth Group Inc #201111956 Report a problem | ||
| 7/30/2011 | Listed for sale | $50,000$24/sqft |
Source: isNowListed.com Report a problem | ||
| 6/12/2011 | Listing removed | $50,000$24/sqft |
Source: isNowListed.com Report a problem | ||
| 6/11/2011 | Listed for sale | $50,000$24/sqft |
Source: isNowListed.com Report a problem | ||
| 4/14/2011 | Listing removed | $50,000$24/sqft |
Source: The Wilmoth Group Inc #201111956 Report a problem | ||
| 3/18/2011 | Listed for sale | $50,000+10.9%$24/sqft |
Source: foreclosure.com Report a problem | ||
| 8/10/2010 | Sold | $45,100-48.8%$22/sqft |
Source: Public Record Report a problem | ||
| 3/3/2010 | Listed for sale | $88,000-44.7%$43/sqft |
Source: The Realty Group of SW FL, Inc #201008487 Report a problem | ||
| 3/7/2008 | Sold | $159,000+622.7%$78/sqft |
Source: Public Record Report a problem | ||
| 11/3/2004 | Sold | $22,000+189.5%$11/sqft |
Source: Public Record Report a problem | ||
| 1/26/2004 | Sold | $7,600+16.9%$4/sqft |
Source: Public Record Report a problem | ||
| 12/15/2003 | Sold | $6,500$3/sqft |
Source: Public Record Report a problem | ||
Public tax history
| Year | Property taxes | Tax assessment |
|---|---|---|
| 2025 | $4,050 +2.4% | $305,065 +2.7% |
| 2024 | $3,955 -6.5% | $297,165 -8.8% |
| 2023 | $4,229 +6.7% | $325,979 +22.9% |
| 2022 | $3,963 +23.2% | $265,162 +27.9% |
| 2021 | $3,217 +4.3% | $207,315 +9.5% |
| 2020 | $3,084 +5.3% | $189,364 +2% |
| 2019 | $2,928 | $185,726 +8.5% |
| 2018 | $2,928 +6.4% | $171,178 +9.3% |
| 2017 | $2,752 +6.5% | $156,662 +15.3% |
| 2016 | $2,584 +9.1% | $135,841 +14.5% |
| 2015 | $2,368 +11.3% | $118,608 +16.6% |
| 2014 | $2,127 +8.2% | $101,696 +18% |
| 2013 | $1,966 +38.4% | $86,213 +21.2% |
| 2012 | $1,421 -0.1% | $71,129 +2.7% |
| 2011 | $1,423 +2.1% | $69,287 +5.6% |
| 2010 | $1,393 -12.5% | $65,590 -17.3% |
| 2009 | $1,592 -54.6% | $79,270 -61.3% |
| 2008 | $3,504 +429.9% | $205,020 +700.9% |
| 2007 | $661 -6.5% | $25,600 -39% |
| 2006 | $707 +713.7% | $42,000 +1100% |
| 2004 | $87 +44.4% | $3,500 +84.2% |
| 2003 | $60 -1.8% | $1,900 |
| 2002 | $61 | $1,900 +18.8% |
| 2000 | -- | $1,600 |
Find assessor info on the county website
Monthly payment
Estimated monthly payment$1,822
All calculations are estimates and provided by Zillow, Inc. for informational purposes only. Actual amounts may vary.
HOA fees may include property taxes on listings classified as Co-Ops. Contact the listing agent and/or owner for fee details.
Mortgage interest rates are dependent on a number of factors, including credit score, down payment, and repayment length. Interest rate data provided by Zillow Group Marketplace, Inc. as of 1/1/1970 from various mortgage lenders with which we have lead or other similar arrangements; the Estimated Payment is an average of those rates.
See how much you could borrow to make a competitive offer.
Climate risks
Neighborhood: 33971
Nearby schools
GreatSchools rating
- 4/10Harns Marsh Elementary SchoolGrades: PK-5Distance: 0.4 mi
- 6/10Harns Marsh Middle SchoolGrades: 6-8Distance: 0.4 mi
- 3/10Lehigh Senior High SchoolGrades: 9-12Distance: 1.7 mi


- Florida
- Lee County
- Lehigh Acres
- 33971
- 3918 8th St SW
Nearby cities
Nearby zip codes
Other Lehigh Acres Topics
