$235,600
3 bd|2 ba|1.3k sqft
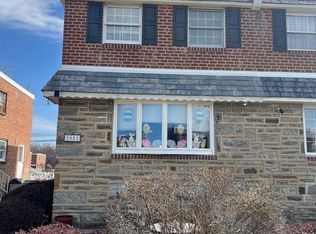
4111 Comly St, Philadelphia, PA 19135
Off Market
Zillow last checked:
Listing updated:
Marco Troche 267-255-8132,
RE/MAX Select Group 2153356900
$368,300
$350,000 - $387,000
$2,184/mo
| Date | Event | Price |
|---|---|---|
| 5/19/2026 | Listed for sale | $375,000+87.6%$266/sqft |
Source: | ||
| 12/24/2020 | Listing removed | $199,850$142/sqft |
Source: Keller Williams Real Estate #PAPH927560 Report a problem | ||
| 8/21/2020 | Listed for sale | $199,850+42.9%$142/sqft |
Source: Keller Williams Realty #PAPH927560 Report a problem | ||
| 12/17/2016 | Listing removed | $139,900$99/sqft |
Source: RE/MAX Affiliates N.E. #6793735 Report a problem | ||
| 5/17/2016 | Listed for sale | $139,900-6.7%$99/sqft |
Source: RE/MAX AFFILIATES #6793735 Report a problem | ||
| 6/2/2013 | Listing removed | $150,000$107/sqft |
Source: Philadelphia Real Estate Professionals #5978385 Report a problem | ||
| 12/2/2011 | Listed for sale | $150,000-3.2%$107/sqft |
Source: Philadelphia Real Estate Professionals #5978385 Report a problem | ||
| 8/18/2011 | Listing removed | $155,000$110/sqft |
Source: Philadelphia Real Estate Professionals #5807838 Report a problem | ||
| 3/5/2011 | Listed for sale | $155,000$110/sqft |
Source: Philadelphia Real Estate Professionals #5807838 Report a problem | ||
| 12/5/2010 | Listing removed | $155,000$110/sqft |
Source: RE/MAX Advantage #5759939 Report a problem | ||
| 8/21/2010 | Listed for sale | $155,000+24%$110/sqft |
Source: RE/MAX Advantage #5759939 Report a problem | ||
| 11/21/2005 | Sold | $125,000$89/sqft |
Source: Public Record Report a problem | ||
| Year | Property taxes | Tax assessment |
|---|---|---|
| 2025 | $3,116 +22.3% | $222,600 +22.3% |
| 2024 | $2,548 | $182,000 |
| 2023 | $2,548 +41.7% | $182,000 |
| 2022 | $1,797 | -- |
| 2021 | $1,797 +4.2% | -- |
| 2018 | $1,725 | -- |
| 2017 | $1,725 +5.1% | -- |
| 2016 | $1,641 | -- |
| 2015 | $1,641 | -- |
| 2014 | $1,641 +4.5% | $117,200 +708.5% |
| 2012 | $1,570 | $14,496 |
| 2011 | -- | $14,496 |
| 2010 | -- | $14,496 |
| 2009 | -- | $14,496 |
| 2008 | -- | $14,496 |
| 2007 | -- | $14,496 +7.6% |
| 2006 | -- | $13,472 |
| 2005 | -- | $13,472 |
| 2004 | -- | $13,472 |
| 2003 | -- | $13,472 |
| 2002 | -- | $13,472 |
| 2000 | -- | $13,472 |
| 1999 | -- | $13,472 |
Find assessor info on the county website
Source: Bright MLS. This data may not be complete. We recommend contacting the local school district to confirm school assignments for this home.
A local agent can set up tours, give advice and negotiate with sellers.