custom brick , decks with concrete pation. covered porch for relaxing and scernery is amazing Lorance creek views and wildlife , bird migratory is spectacular, home is cozy and roon wall colors are comforting new painted, easy clean windows. Beautiful doors just replaced hill side land. small neighborhood, pulaski or saline near both on the county line. 20 minute drive approx to anywhere in LR with country living feel.
For sale by owner
$152,000
4123 Lorance Ter, Little Rock, AR 72206
2beds
1,070sqft
SingleFamily
Built in 2005
0.5 Acres Lot
$-- Zestimate®
$142/sqft
$-- HOA
What's special
Custom brickBeautiful doors just replacedAmazing lorance creek viewsHill side landEasy clean windowsCovered porch for relaxing
What the owner loves about this home
Hill top home
- 27 days
- 187
- 13
Listed by:
Property Owner (501) 298-0141
Facts & features
Interior
Bedrooms & bathrooms
- Bedrooms: 2
- Bathrooms: 1
- Full bathrooms: 1
Heating
- Forced air, Other, Electric, Gas
Cooling
- Central
Appliances
- Included: Dishwasher, Microwave, Range / Oven, Refrigerator
Features
- Flooring: Tile, Carpet
- Has fireplace: Yes
Interior area
- Total interior livable area: 1,070 sqft
Property
Parking
- Total spaces: 1
- Parking features: Garage - Attached
Features
- Exterior features: Stone, Brick
- Has view: Yes
- View description: Territorial
Lot
- Size: 0.5 Acres
Details
- Parcel number: 35R0320100800
Construction
Type & style
- Home type: SingleFamily
Materials
- Foundation: Piers
- Roof: Composition
Condition
- New construction: No
- Year built: 2005
Utilities & green energy
- Utilities for property: Elec-Municipal (+Entergy)
Community & HOA
Location
- Region: Little Rock
Financial & listing details
- Price per square foot: $142/sqft
- Tax assessed value: $141,000
- Annual tax amount: $541
- Date on market: 10/16/2026
Estimated market value
Not available
Estimated sales range
Not available
$1,048/mo
Price history
| Date | Event | Price |
|---|---|---|
| 10/16/2026 | Listed for sale | $152,000+63.4%$142/sqft |
Source: Owner Report a problem | ||
| 4/15/2020 | Sold | $93,000+86%$87/sqft |
Source: Public Record Report a problem | ||
| 6/28/2017 | Sold | $50,000-27.5%$47/sqft |
Source:  CARMLS #17011881 Report a problem | ||
| 4/21/2017 | Listed for sale | $69,000+8.8%$64/sqft |
Source: Homepath #17011881 Report a problem | ||
| 3/29/2017 | Sold | $63,429-85.8%$59/sqft |
Source: Public Record Report a problem | ||
| 3/1/2017 | Listed for sale | -- |
Source: Auction.com Report a problem | ||
| 6/30/2010 | Sold | $447,500$418/sqft |
Source: Agent Provided Report a problem | ||
Public tax history
| Year | Property taxes | Tax assessment |
|---|---|---|
| 2025 | $541 -8.8% | $22,470 +4.4% |
| 2024 | $594 -4.4% | $21,530 +4.6% |
| 2023 | $621 -0.4% | $20,590 +4.8% |
| 2022 | $623 +8.3% | $19,650 +5% |
| 2021 | $575 | $18,710 |
| 2020 | $575 -39.5% | $18,710 |
| 2019 | $950 | $18,710 |
| 2018 | $950 +131.8% | $18,710 |
| 2017 | $410 | $18,710 +25.1% |
| 2016 | $410 -46.1% | $14,960 |
| 2015 | $760 | $14,960 |
| 2014 | $760 -44.2% | $14,960 -44.2% |
| 2013 | $1,363 | $26,830 |
| 2012 | -- | $26,830 +79.3% |
| 2011 | -- | $14,963 |
| 2010 | -- | $14,963 |
| 2009 | -- | $14,963 +20.1% |
| 2008 | -- | $12,455 |
| 2007 | -- | $12,455 +15% |
| 2005 | -- | $10,830 |
| 2004 | -- | $10,830 +17.3% |
| 2003 | -- | $9,236 |
| 2002 | -- | $9,236 |
| 2001 | -- | $9,236 |
Find assessor info on the county website
Monthly payment
Est. payment
Payment breakdown
Explore the cost of this home by adjusting the details. Changes won't be saved.Climate risks
Neighborhood: 72206
Similar homes
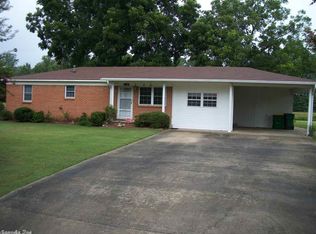
- $--3 bd2 ba1.3k sqft16707 Rowe Rd, Little Rock, AR 72206Auction
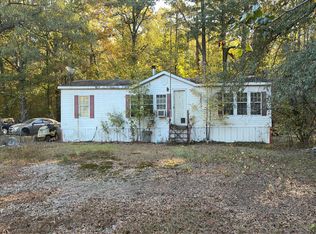 Auction.com 2
- $155,0003 bd1 ba1.2k sqft4305 Singley Rd, Little Rock, AR 72206For Sale

 MLS ID #26041947, Adrienne Roberts, Arcadian Realty. CARMLS
- $150,0003 bd3 ba1.6k sqft4811 N Landmark Cir, Little Rock, AR 72206For Sale
 MLS ID #26040747, Buffie C Howard, Truman Ball Real Estate. CARMLS
- $139,9002 bd1 ba1k sqft12702 Arch St, Little Rock, AR 72206For Sale
 MLS ID #26044482, Chris N Cobb, Truman Ball Real Estate. CARMLS
- $149,9003 bd2 ba1.5k sqft16520 Landmark Rd, Little Rock, AR 72206For SaleMLS ID #26026341, Misty Snyder, IRealty Arkansas - Sherwood. CARMLS
- $145,0003 bd2 ba1.2k sqft105 Deer Run Dr, Little Rock, AR 72206For SaleMLS ID #26044664, Cornelius A Hood, Dream Space Realty Group. CARMLS
- $120,0003 bd2 ba1.1k sqft4119 Singley Rd, Little Rock, AR 72206For SaleMLS ID #26040905, Sergio Convers, Capital Real Estate Advisors. CARMLS
- $155,0004 bd2 ba1.2k sqft13724 Joan Dr, Shannon Hills, AR 72103For SaleMLS ID #26045037, Michael King, Century 21 Parker & Scroggins Realty - Bryant. CARMLS
- $137,0003 bd2 ba1.1k sqft3 Pine Thicket Ct, Little Rock, AR 72206For SaleMLS ID #26041591, Stacy Hagan, Century 21 Parker & Scroggins Realty - Bryant. CARMLS
- $170,0003 bd2 ba1.1k sqft3008 Pine Ridge Dr, Little Rock, AR 72206New ConstructionMLS ID #26035954, Aracely Galan, Capital Real Estate Advisors. CARMLS
- $149,9003 bd2 ba1k sqft10608 Shannon Hills Dr, Shannon Hills, AR 72103For SaleMLS ID #26044238, Chase R Calhoun, Chase Calhoun Real Estate LLC. CARMLS
- $129,0003 bd2 ba960 sqft8826 Fairview Rd, Hensley, AR 72065For SaleMLS ID #26045400, Dawn House, Century 21 Parker & Scroggins Realty - Benton. CARMLS
- $105,0004 bd2 ba1k sqft3115 Garniece Dr, Little Rock, AR 72206For SaleMLS ID #26022218, Kari L Clay, Mid South Realty. CARMLS
- $155,9003 bd2 ba1.3k sqft10312 Republic Ln, Little Rock, AR 72209For SaleMLS ID #26043458, Tara J Helgestad, Lotus Realty. CARMLS
- $149,0003 bd2 ba1.5k sqft10608 Lionel Dr, Little Rock, AR 72209For SaleMLS ID #26042681, Jamie M Hoffman, River Rock Realty Company. CARMLS
- $149,0002 bd1 ba1k sqft11612 Warren Rd, Little Rock, AR 72209For SaleMLS ID #26029949, Katherina Yancy, Keller Williams Realty. CARMLS
- $130,0002 bd2 ba1k sqft619 Brewer Rd, Little Rock, AR 72206For SaleMLS ID #26041200, Ashley Cifreo, Michele Phillips & Co. Realtors Searcy Branch. CARMLS
