This 1955 square foot single family home has 3 bedrooms and 2.0 bathrooms. This home is located at 421 Nelson Rd N, Cape Coral, FL 33993.
Pre-foreclosure
Est. $309,100
421 Nelson Rd N, Cape Coral, FL 33993
3beds
2baths
1,955sqft
SingleFamily
Built in 2007
10,018 Square Feet Lot
$309,100 Zestimate®
$158/sqft
$-- HOA
Overview
- 146 days
- 2
- 0
Facts & features
Interior
Bedrooms & bathrooms
- Bedrooms: 3
- Bathrooms: 2
Heating
- Forced air
Cooling
- Other
Appliances
- Included: Dishwasher, Dryer, Washer
- Laundry: In Unit
Features
- Flooring: Hardwood
- Furnished: Yes
Interior area
- Total interior livable area: 1,955 sqft
Property
Parking
- Parking features: Garage - Detached
Features
- Exterior features: Stucco
Lot
- Size: 10,018 Square Feet
Details
- Parcel number: 114423C1025520260
Construction
Type & style
- Home type: SingleFamily
Materials
- Roof: Asphalt
Condition
- Year built: 2007
Community & HOA
Location
- Region: Cape Coral
Financial & listing details
- Price per square foot: $158/sqft
- Tax assessed value: $246,699
- Annual tax amount: $4,947
Foreclosure details
Estimated market value
$309,100
$291,000 - $328,000
$2,052/mo
Price history
| Date | Event | Price |
|---|---|---|
| 8/27/2025 | Listing removed | $292,900$150/sqft |
Source:  Florida Gulf Coast MLS #225021858 Report a problem | ||
| 3/31/2025 | Price change | $292,900+2.8%$150/sqft |
Source:  SWFLMLS #225021858 Report a problem | ||
| 2/27/2025 | Listed for sale | $284,900$146/sqft |
Source: SWFLMLS #225021858 Report a problem | ||
| 2/26/2025 | Listing removed | $284,900$146/sqft |
Source: SWFLMLS #224066071 Report a problem | ||
| 2/23/2025 | Listed for sale | $284,900$146/sqft |
Source: SWFLMLS #224066071 Report a problem | ||
| 2/11/2025 | Pending sale | $284,900$146/sqft |
Source: SWFLMLS #224066071 Report a problem | ||
| 1/14/2025 | Price change | $284,900-5%$146/sqft |
Source: SWFLMLS #224066071 Report a problem | ||
| 12/22/2024 | Price change | $299,900-13.4%$153/sqft |
Source: SWFLMLS #224066071 Report a problem | ||
| 9/14/2024 | Price change | $346,250-1.4%$177/sqft |
Source: SWFLMLS #224066071 Report a problem | ||
| 8/14/2024 | Listed for sale | $351,250-2.4%$180/sqft |
Source: SWFLMLS #224066071 Report a problem | ||
| 7/24/2024 | Listing removed | -- |
Source: Zillow Rentals Report a problem | ||
| 7/6/2024 | Listed for rent | $2,395-17.4%$1/sqft |
Source: Zillow Rentals Report a problem | ||
| 3/13/2024 | Listing removed | -- |
Source: Zillow Rentals Report a problem | ||
| 2/27/2024 | Price change | $2,900+16%$1/sqft |
Source: Zillow Rentals Report a problem | ||
| 2/24/2024 | Price change | $2,500+6.4%$1/sqft |
Source: Zillow Rentals Report a problem | ||
| 1/12/2024 | Price change | $2,350-17.5%$1/sqft |
Source: Zillow Rentals Report a problem | ||
| 1/9/2024 | Listed for rent | $2,850+16.3%$1/sqft |
Source: Zillow Rentals Report a problem | ||
| 12/3/2023 | Listing removed | -- |
Source: Zillow Rentals Report a problem | ||
| 11/7/2023 | Price change | $2,450-3.9%$1/sqft |
Source: Zillow Rentals Report a problem | ||
| 11/3/2023 | Price change | $2,550-5.6%$1/sqft |
Source: Zillow Rentals Report a problem | ||
| 10/31/2023 | Listed for rent | $2,700+86.2%$1/sqft |
Source: Zillow Rentals Report a problem | ||
| 10/26/2023 | Listing removed | -- |
Source: Zillow Rentals Report a problem | ||
| 10/20/2023 | Price change | $1,450-49.1%$1/sqft |
Source: Zillow Rentals Report a problem | ||
| 10/19/2023 | Listed for rent | $2,850$1/sqft |
Source: Zillow Rentals Report a problem | ||
| 5/8/2023 | Listing removed | -- |
Source: Zillow Rentals Report a problem | ||
| 6/24/2022 | Sold | $360,000+263.6%$184/sqft |
Source: Florida Gulf Coast MLS #222010728 Report a problem | ||
| 7/2/2012 | Sold | $99,000-45.3%$51/sqft |
Source: Public Record Report a problem | ||
| 5/2/2007 | Sold | $181,000+596.2%$93/sqft |
Source: Public Record Report a problem | ||
| 5/19/2004 | Sold | $26,000$13/sqft |
Source: Public Record Report a problem | ||
Public tax history
| Year | Property taxes | Tax assessment |
|---|---|---|
| 2025 | $4,947 -1.6% | $246,699 -5.1% |
| 2024 | $5,025 -18% | $260,091 -10.8% |
| 2023 | $6,131 +94.6% | $291,639 +167.6% |
| 2022 | $3,150 +0.5% | $108,999 +3% |
| 2021 | $3,133 -4.7% | $105,824 +1.4% |
| 2020 | $3,287 +2% | $104,363 -34.7% |
| 2019 | $3,224 | $159,892 +59.7% |
| 2018 | $3,224 +0.7% | $100,115 +2.1% |
| 2017 | $3,201 +88.1% | $98,056 -28.9% |
| 2016 | $1,702 +3.7% | $137,998 +13.7% |
| 2015 | $1,640 +0.7% | $121,411 +9.4% |
| 2014 | $1,629 +3.5% | $110,993 +19.1% |
| 2013 | $1,574 -22.8% | $93,216 +11.3% |
| 2012 | $2,038 +8.1% | $83,789 +15.2% |
| 2011 | $1,886 +0.7% | $72,760 +3.3% |
| 2010 | $1,873 +30.8% | $70,450 -20.4% |
| 2009 | $1,432 -46.7% | $88,560 -48.3% |
| 2008 | $2,685 +332.3% | $171,240 +443.6% |
| 2007 | $621 -50.8% | $31,500 -52.4% |
| 2006 | $1,263 +465% | $66,200 +678.8% |
| 2004 | $224 +74.6% | $8,500 +104.3% |
| 2003 | $128 +48.6% | $4,160 +89.1% |
| 2002 | $86 | $2,200 +12.2% |
| 2000 | -- | $1,960 |
Find assessor info on the county website
Monthly payment
Climate risks
Neighborhood: 33993


Similar homes
- $314,9004 bd2 ba1.8k sqft318 NW 4th St, Cape Coral, FL 33993For Sale
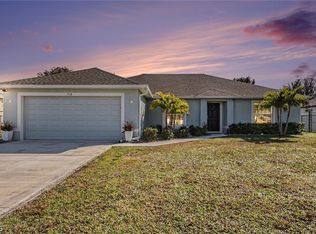
 MLS ID #2026029338, Joel Parrott, Expert Realty Solutions Inc.. Florida Gulf Coast MLS
- $275,0003 bd2 ba1.4k sqft1920 NW 15th Pl, Cape Coral, FL 33993For Sale
 MLS ID #2026045373, Marlissa Gervasoni, Century 21 AllPoints Realty. Florida Gulf Coast MLS
- $330,0004 bd2 ba1.6k sqft212 NW 28th Ter, Cape Coral, FL 33993For Sale
 MLS ID #2026035230, Cylina Slajda, Valor Real Estate Svs. Florida Gulf Coast MLS
- $309,9003 bd2 ba1.2k sqft1423 NW 19th St, Cape Coral, FL 33993For Sale
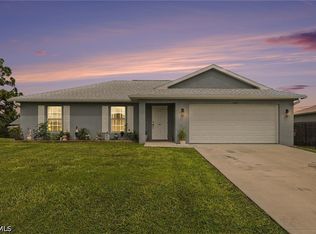 MLS ID #2026041420, Susan Flora, Rossman Realty Group Inc. Florida Gulf Coast MLS
- $279,9003 bd2 ba1.4k sqft2837 NW 27th Pl, Cape Coral, FL 33993For SaleMLS ID #2026041512, George Sand, RE/MAX Trend. Florida Gulf Coast MLS
- $350,0003 bd2 ba1.9k sqft1312 SW 27th Ter, Cape Coral, FL 33914For SaleMLS ID #2026044913, Lindsey Springsteen, Real Broker, LLC. Florida Gulf Coast MLS
- $349,9004 bd3 ba2k sqft23 NW 29th Ave, Cape Coral, FL 33993For SaleMLS ID #2026020739, Kim Maxwell, Raso Realty Inc. Florida Gulf Coast MLS
- $299,0003 bd2 ba1.4k sqft147 SE 19th Ln, Cape Coral, FL 33990For SaleMLS ID #2026042987, Christina Marie Diaz, EXP Realty LLC. Florida Gulf Coast MLS
- $369,0004 bd2 ba2.3k sqft1732 NW 15th Ter, Cape Coral, FL 33993For SaleMLS ID #2026041316, Heather Sowder, Palm Paradise Realty Group. Florida Gulf Coast MLS
- $340,0004 bd2 ba1.8k sqft3225 NW 21st St, Cape Coral, FL 33993For SaleMLS ID #2026041643, Livia Nemes, Century 21 Selling Paradise. Florida Gulf Coast MLS
- $325,0003 bd2 ba1.5k sqft3130 SW 19th Ave, Cape Coral, FL 33914For SaleMLS ID #2026044226, Dayman Diaz, Florida's Link Realty, Inc. Florida Gulf Coast MLS
- $319,9003 bd2 ba1.3k sqft1502 SE 2nd Pl, Cape Coral, FL 33990For SaleMLS ID #2026023516, Andy Molina, Ace Realty & Associates, LLC. Florida Gulf Coast MLS
- $389,9994 bd3 ba2.1k sqft16 NW 18th Ave, Cape Coral, FL 33993For SaleMLS ID #2026020059, Lucy Morey, Mamba Realty LLC. Florida Gulf Coast MLS
- $324,9004 bd2 ba1.8k sqft322 NW 21st St, Cape Coral, FL 33993For SaleMLS ID #2026034091, Patti Polensky, Premiere Plus Realty Company. Florida Gulf Coast MLS
- $309,9994 bd2 ba1.8k sqft4317 SW 9th Pl, Cape Coral, FL 33914For SaleMLS ID #2026043590, Ava Beats, Coldwell Banker Realty. Florida Gulf Coast MLS
- $334,9003 bd2 ba1.4k sqft1630 SW 15th Ave, Cape Coral, FL 33991For SaleMLS ID #2026017201, Jimi Walton, Schooner Bay Realty, Inc.. Florida Gulf Coast MLS
- $430,0004 bd3 ba2.5k sqft30 SW 15th Ter, Cape Coral, FL 33991For SaleMLS ID #2026042069, Jason Knutson, Coldwell Banker Realty. Florida Gulf Coast MLS
- $367,0003 bd2 ba1.5k sqft3706 NW 1st Ter, Cape Coral, FL 33993For SaleMLS ID #2026013496, Frank Petrizze, Epique Realty Inc.. Florida Gulf Coast MLS
- $350,0003 bd2 ba1.8k sqft4012 NW 36th Pl, Cape Coral, FL 33993For SaleMLS ID #2026028286, Renee Witul, Hossler Realty Services LLC. Florida Gulf Coast MLS
- $339,9003 bd2 ba1.5k sqft1826 SW Trafalgar Pkwy, Cape Coral, FL 33991For SaleMLS ID #2026005789, Anita Gross, Paradise Exclusive Inc. Florida Gulf Coast MLS
