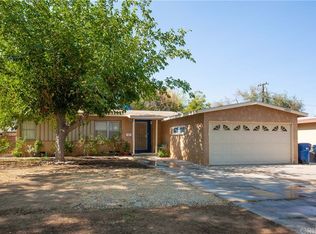
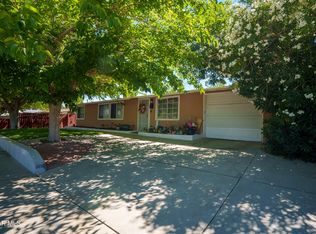
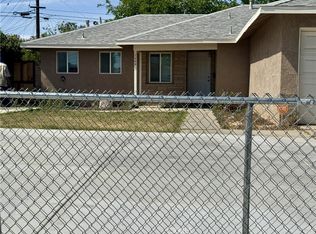
Very Nice clean home in establish neighborhood close to shopping ,schools ,transportation and free way.
Pre-foreclosure
Street View
Est. $347,600
45321 11th St W, Lancaster, CA 93534
3beds
1baths
1,010sqft
SingleFamily
Built in 1953
6,664 Square Feet Lot
$347,600 Zestimate®
$344/sqft
$-- HOA
Overview
- 79 days |
- 24 |
- 0 |
Facts & features
Interior
Bedrooms & bathrooms
- Bedrooms: 3
- Bathrooms: 1
Heating
- Forced air
Cooling
- Central
Features
- Flooring: Tile, Carpet
Interior area
- Total interior livable area: 1,010 sqft
Property
Parking
- Total spaces: 1
Features
- Exterior features: Composition
Lot
- Size: 6,664 Square Feet
Details
- Parcel number: 3120027004
Construction
Type & style
- Home type: SingleFamily
- Architectural style: Conventional
Materials
- Roof: Composition
Condition
- Year built: 1953
Community & HOA
Location
- Region: Lancaster
Financial & listing details
- Price per square foot: $344/sqft
- Tax assessed value: $334,279
- Annual tax amount: $5,475
Visit our professional directory to find a foreclosure specialist in your area that can help with your home search.
Find a foreclosure agentForeclosure details
Estimated market value
$347,600
$316,000 - $375,000
$2,614/mo
Price history
| Date | Event | Price |
|---|---|---|
| 1/9/2024 | Listing removed | -- |
Source: Zillow Rentals Report a problem | ||
| 1/4/2024 | Listed for rent | $2,350-2.1%$2/sqft |
Source: Zillow Rentals Report a problem | ||
| 12/23/2023 | Listing removed | -- |
Source: Zillow Rentals Report a problem | ||
| 12/3/2023 | Price change | $2,400-4%$2/sqft |
Source: Zillow Rentals Report a problem | ||
| 12/1/2023 | Listed for rent | $2,500+150%$2/sqft |
Source: Zillow Rentals Report a problem | ||
| 8/23/2021 | Sold | $315,000+8.7%$312/sqft |
Source: Public Record Report a problem | ||
| 6/23/2021 | Contingent | $289,900$287/sqft |
Source: | ||
| 6/18/2021 | Listed for sale | $289,900+26254.5%$287/sqft |
Source: | ||
| 9/10/2013 | Listing removed | $1,000$1/sqft |
Source: Amigo Real Estate #1210589 Report a problem | ||
| 8/8/2013 | Price change | $1,000-16.7%$1/sqft |
Source: Amigo Real Estate #1210589 Report a problem | ||
| 8/6/2013 | Price change | $1,200+20%$1/sqft |
Source: Go Section8 Report a problem | ||
| 8/4/2013 | Price change | $1,000-16.7%$1/sqft |
Source: Amigo Real Estate #1210589 Report a problem | ||
| 8/2/2013 | Price change | $1,200+20%$1/sqft |
Source: Go Section8 Report a problem | ||
| 8/1/2013 | Price change | $1,000-52.4%$1/sqft |
Source: Amigo Real Estate #1210589 Report a problem | ||
| 1/6/2013 | Listed for rent | $2,100$2/sqft |
Source: Cobblestone Realty Inc. #1210589 Report a problem | ||
| 12/6/2012 | Listing removed | $1,100$1/sqft |
Source: Cobblestone Realty Inc. #1210589 Report a problem | ||
| 11/1/2012 | Listed for sale | $1,100-99.1%$1/sqft |
Source: Cobblestone Realty Inc. #1210589 Report a problem | ||
| 2/11/2004 | Sold | $125,000+66.7%$124/sqft |
Source: Public Record Report a problem | ||
| 9/4/1998 | Sold | $75,000-25.5%$74/sqft |
Source: Public Record Report a problem | ||
| 2/2/1998 | Sold | $100,698$100/sqft |
Source: Public Record Report a problem | ||
Public tax history
| Year | Property taxes | Tax assessment |
|---|---|---|
| 2025 | $5,475 +3.4% | $334,279 +2% |
| 2024 | $5,293 +2.2% | $327,725 +2% |
| 2023 | $5,179 +4.6% | $321,300 +2% |
| 2022 | $4,951 +76.7% | $315,000 +91.9% |
| 2021 | $2,803 +1.1% | $164,172 +1% |
| 2020 | $2,773 | $162,489 +2% |
| 2019 | $2,773 +3.5% | $159,304 +2% |
| 2018 | $2,679 | $156,182 +6.8% |
| 2017 | $2,679 +4.4% | $146,200 +24.2% |
| 2016 | $2,567 +18.5% | $117,700 |
| 2015 | $2,166 +16.5% | $117,700 +31.5% |
| 2014 | $1,859 | $89,500 +17.8% |
| 2012 | -- | $76,000 +18% |
| 2011 | -- | $64,400 |
| 2010 | -- | $64,400 -26.7% |
| 2009 | -- | $87,900 -35% |
| 2008 | -- | $135,301 +2% |
| 2007 | -- | $132,649 +2% |
| 2006 | -- | $130,049 |
| 2005 | -- | $130,049 +57.3% |
| 2004 | -- | $82,695 +1.9% |
| 2003 | -- | $81,180 +2% |
| 2002 | -- | $79,589 +4% |
| 2000 | -- | $76,500 |
Find assessor info on the county website
Monthly payment
Estimated monthly payment$1,822
All calculations are estimates and provided by Zillow, Inc. for informational purposes only. Actual amounts may vary.
HOA fees may include property taxes on listings classified as Co-Ops. Contact the listing agent and/or owner for fee details.
Mortgage interest rates are dependent on a number of factors, including credit score, down payment, and repayment length. Interest rate data provided by Zillow Group Marketplace, Inc. as of 1/1/1970 from various mortgage lenders with which we have lead or other similar arrangements; the Estimated Payment is an average of those rates.
See how much you could borrow to make a competitive offer.
Climate risks
Neighborhood: Desert View
Nearby schools
GreatSchools rating
- 2/10Desert View Elementary SchoolGrades: K-6Distance: 0.6 mi
- 2/10Piute Middle SchoolGrades: 6-8Distance: 1.7 mi
- 3/10Antelope Valley High SchoolGrades: 9-12Distance: 1.2 mi


- California
- Los Angeles County
- Lancaster
- 93534
- Desert View
- 45321 11th St W
Nearby cities
Nearby neighborhoods
Nearby zip codes
Other Lancaster Topics
