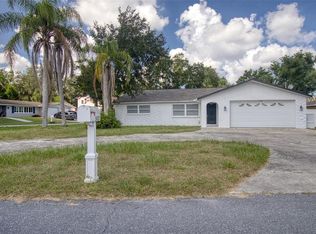
Come see this completely renovated and move-in ready waterfront home in New Port Richey. This 3 bedroom, 1 bath home offers a one car garage, plus a bonus den overlooking the water with French doors leading to the patio. The layout provides a comfortable mix of living space and flexibility, whether the den is used as a home office, sitting area, or extra space for guests. The home has been updated throughout with new impact rated windows and doors, HVAC, water heater, electrical panel, flooring, kitchen, and bathrooms. The kitchen features shaker-style cabinetry, ceramic tile backsplash, stainless steel appliances, and quartz countertops. Tile flooring throughout the home makes for an easy-to-maintain interior. Outside, enjoy the waterfront setting from the patio and take advantage of the nearby waterways. Bring your kayaks, boat, and beach gear, with public boat ramps and Gulf Coast beaches just minutes away. There's plenty here to enjoy whether you're looking for a place to relax at home or want to get out and explore the area. Conveniently located near US 19, the home is close to shopping, restaurants, parks, and everyday amenities. Downtown New Port Richey is just a short drive away, offering local restaurants, entertainment, events, and outdoor spaces including Sims Park. Seven Springs Golf & Country Club and other area parks and trails are also nearby. With the major updates already taken care of, you can move right in and make the space your own with your personal style and finishing touches. A great opportunity to own an updated waterfront home in a convenient New Port Richey location. Make an appointment for a private showing today.
For sale
Price cut: $10.1K (10/21)
$284,900
4539 NEEDLE PALM DRIVE, NEW PORT RICHEY, FL 34652
3beds
1,432sqft
Single Family Residence
Built in 1973
6,552 Square Feet Lot
$277,800 Zestimate®
$199/sqft
$-- HOA
What's special
One car garageQuartz countertopsWaterfront homeNearby waterwaysWater heaterStainless steel appliancesElectrical panel
- 28 days
- 248
- 29
Likely to sell faster than
Zillow last checked:
Listing updated:
Listed by:
Randall Heffernan 813-857-8592,
FRANK ALBERT REALTY 813-546-2503
Source: Stellar MLS,MLS#: TB8554175 Originating MLS: Suncoast Tampa
Facts & features
Interior
Bedrooms & bathrooms
- Bedrooms: 3
- Bathrooms: 1
- Full bathrooms: 1
Rooms
- Room types: Bonus Room
Primary bedroom
- Features: Built-in Closet
- Level: First
- Area: 195 Square Feet
- Dimensions: 13x15
Kitchen
- Level: First
- Area: 144 Square Feet
- Dimensions: 12x12
Living room
- Level: First
- Area: 210 Square Feet
- Dimensions: 14x15
Heating
- Central
Cooling
- Central Air
Appliances
- Included: Dishwasher, Microwave, Range, Refrigerator
- Laundry: In Garage
Features
- Other
- Flooring: Ceramic Tile
- Doors: French Doors
- Has fireplace: No
Interior area
- Total structure area: 1,432
- Total interior livable area: 1,432 sqft
Video & virtual tour
Property
Parking
- Total spaces: 1
- Parking features: Garage - Attached
- Attached garage spaces: 1
Features
- Levels: One
- Stories: 1
- Has view: Yes
- View description: Lake, Pond
- Has water view: Yes
- Water view: Lake,Pond
- Waterfront features: Lake Front, Pond, Lake Privileges, Pond Access
Lot
- Size: 6,552 Square Feet
Details
- Parcel number: 162618011.0000.00021.0
- Zoning: R4
- Special conditions: None
Construction
Type & style
- Home type: SingleFamily
- Property subtype: Single Family Residence
Materials
- Block, Stucco
- Foundation: Slab
- Roof: Shingle
Condition
- New construction: No
- Year built: 1973
Utilities & green energy
- Sewer: Public Sewer
- Water: Public
- Utilities for property: Other
Community & HOA
Community
- Pet fee: $0 monthly
- Subdivision: BEACON WOODS GOLF COUNTRY
HOA
- Has HOA: No
Location
- Region: New Port Richey
Financial & listing details
- Price per square foot: $199/sqft
- Tax assessed value: $189,991
- Annual tax amount: $209
- Date on market: 10/2/2026
- Cumulative days on market: 29 days
- Listing terms: Cash,Conventional,FHA,VA Loan
- Ownership: Fee Simple
- Total actual rent: 0
- Road surface type: Paved
Estimated market value
$277,800
$264,000 - $292,000
$1,910/mo
Price history
| Date | Event | Price |
|---|---|---|
| 10/21/2026 | Price change | $284,900-3.4%$199/sqft |
Source:  Stellar MLS #TB8554175 Report a problem | ||
| 10/2/2026 | Listed for sale | $295,000+268.8%$206/sqft |
Source: Stellar MLS #TB8554175 Report a problem | ||
| 10/29/2025 | Sold | $80,000-7.8%$56/sqft |
Source: Public Record Report a problem | ||
| 3/21/2017 | Sold | $86,737+14.1%$61/sqft |
Source: Public Record Report a problem | ||
| 12/28/2010 | Sold | $76,000+11.1%$53/sqft |
Source: Public Record Report a problem | ||
| 11/7/2010 | Pending sale | $68,400$48/sqft |
Source: Neighborhood Stimulus Group LL #7466433 Report a problem | ||
| 9/2/2010 | Price change | $68,400-5%$48/sqft |
Source: Neighborhood Stimulus Group LL #7466433 Report a problem | ||
| 7/24/2010 | Price change | $72,000-5.9%$50/sqft |
Source: Neighborhood Stimulus Group LL #7466433 Report a problem | ||
| 6/5/2010 | Price change | $76,500-8.9%$53/sqft |
Source: Neighborhood Stimulus Group LL #7466433 Report a problem | ||
| 3/28/2010 | Listed for sale | $84,000+36%$59/sqft |
Source: Neighborhood Stimulus Group LL #7440473 Report a problem | ||
| 7/28/2009 | Sold | $61,750-27.3%$43/sqft |
Source: Public Record Report a problem | ||
| 3/10/2009 | Listing removed | $84,900$59/sqft |
Source: Listhub #7393453 Report a problem | ||
| 1/19/2009 | Listed for sale | $84,900-34.3%$59/sqft |
Source: Listhub #7393453 Report a problem | ||
| 12/1/2003 | Sold | $129,281+269.4%$90/sqft |
Source: Public Record Report a problem | ||
| 9/9/2002 | Sold | $35,000$24/sqft |
Source: Public Record Report a problem | ||
Public tax history
| Year | Property taxes | Tax assessment |
|---|---|---|
| 2025 | $209 +3.5% | $189,991 -8.2% |
| 2024 | $202 +3.6% | $206,973 +52.2% |
| 2023 | $195 +3.7% | $136,020 +10% |
| 2022 | $188 +3.9% | $123,660 +21% |
| 2021 | $181 +4% | $102,200 +10% |
| 2020 | $174 +4.2% | $92,910 +10% |
| 2019 | $167 | $84,470 -4.8% |
| 2018 | $167 +4.4% | $88,768 +27.1% |
| 2017 | $160 -87.8% | $69,815 +2.7% |
| 2016 | $1,312 +109.9% | $68,000 +11.4% |
| 2015 | $625 +3.3% | $61,051 -3% |
| 2014 | $605 | $62,924 +5.5% |
| 2013 | -- | $59,671 +0.8% |
| 2012 | -- | $59,179 -0.8% |
| 2011 | -- | $59,654 -0.2% |
| 2010 | -- | $59,774 -46.7% |
| 2009 | -- | $112,068 -3.3% |
| 2008 | -- | $115,870 -7.3% |
| 2007 | -- | $125,031 +5.7% |
| 2006 | -- | $118,251 +53.1% |
| 2005 | -- | $77,261 +14.8% |
| 2004 | -- | $67,296 +21.5% |
| 2003 | -- | $55,396 +0.2% |
| 2002 | -- | $55,282 +31.4% |
| 2000 | -- | $42,062 |
| 1999 | -- | $42,062 |
Find assessor info on the county website
Monthly payment
Est. payment
Payment breakdown
Explore the cost of this home by adjusting the details. Changes won't be saved.Climate risks
Neighborhood: 34652
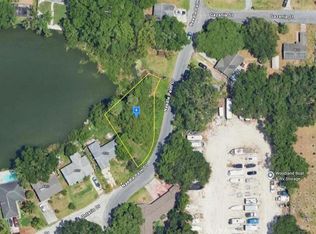

Similar homes
- $275,0004 bd2 ba1.3k sqft4624 PIRATE PLACE, NEW PORT RICHEY, FL 34652For Sale
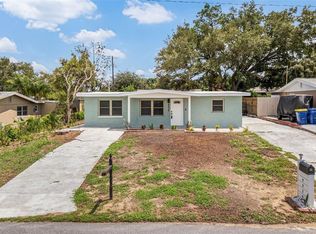
 MLS ID #TB8541559, Veronica Lopez, TAMPA INVESTORS SOLUTIONS LLC. Stellar MLS
- $274,9004 bd2 ba1.6k sqft4506 POOLE STREET, NEW PORT RICHEY, FL 34652For Sale
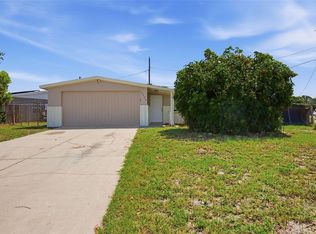 MLS ID #O6422052, Teresa Homan, MAINSTAY BROKERAGE LLC. Stellar MLS
- $254,9003 bd2 ba1.3k sqft5817 10TH AVENUE, NEW PORT RICHEY, FL 34652For Sale
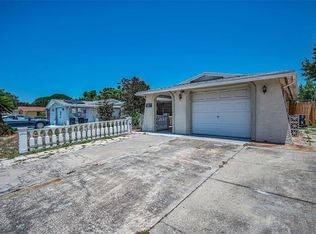 MLS ID #W7886852, Jennifer Tobey, PA, RE/MAX CHAMPIONS. Stellar MLS
- $279,0003 bd2 ba1.7k sqft5425 DRINKARD DRIVE, NEW PORT RICHEY, FL 34653For Sale
 MLS ID #TB8546206, Teresa Ashley, INVESTORS CHOICE REALTY. Stellar MLS
- $259,0003 bd2 ba1.3k sqft7377 ROYAL PALM DRIVE, NEW PORT RICHEY, FL 34652For SaleMLS ID #TB8538171, Jatnna Jimenez, LPT REALTY, LLC. Stellar MLS
- $245,0003 bd1 ba1.1k sqft4820 SALEM DRIVE, NEW PORT RICHEY, FL 34652For SaleMLS ID #TB8515079, Veronica Lopez, TAMPA INVESTORS SOLUTIONS LLC. Stellar MLS
- $314,0003 bd2 ba1.2k sqft7229 PLATHE ROAD, NEW PORT RICHEY, FL 34653For SaleMLS ID #TB8558131, Martha Loss, RE/MAX COLLECTIVE. Stellar MLS
- $274,9003 bd2 ba1.2k sqft4601 EASTWOOD LANE, HOLIDAY, FL 34690For SaleMLS ID #TB8560463, Caroline Hanna, CHARLES RUTENBERG REALTY INC. Stellar MLS
- $299,9003 bd2 ba1.5k sqft4251 WOODFIELD AVENUE, HOLIDAY, FL 34691For SaleMLS ID #TB8545580, Antonio Vera, HOME PRIME REALTY LLC. Stellar MLS
- $295,0003 bd2 ba1.3k sqft6400 MONTANA AVENUE, NEW PORT RICHEY, FL 34653For SaleMLS ID #TB8529661, Natalia Bedoya Vanegas, SHARKS REALTY GROUP LLC. Stellar MLS
- $280,4003 bd2 ba1.5k sqft5600 ANDREA DRIVE, HOLIDAY, FL 34690For SaleMLS ID #O6437340, Blake Keathley, EVERYSTATE INC.. Stellar MLS
- $269,9993 bd2 ba1.1k sqft6338 ABERDEEN AVENUE, NEW PORT RICHEY, FL 34653For SaleMLS ID #TB8518562, Lilibeth Garcia, LA ROSA REALTY, LLC. Stellar MLS
- $288,0003 bd2 ba1k sqft7342 IVORY TERRACE, NEW PORT RICHEY, FL 34655For SaleMLS ID #TB8531518, Jane Mak Makhlouf, JM REAL ESTATE SOLUTIONS. Stellar MLS
- $259,9003 bd2 ba1.3k sqft6244 6TH AVENUE, NEW PORT RICHEY, FL 34653For SaleMLS ID #O6415524, Robert Salmons, ENTERA REALTY LLC. Stellar MLS
- $349,9002 bd2 ba1.6k sqft4559 INGERSOL PLACE, NEW PORT RICHEY, FL 34652For SaleMLS ID #TB8527530, Leslie Rubero, YOU FIRST REALTY AND ASSOC LLC. Stellar MLS
- $279,5003 bd2 ba1.3k sqft6430 BALDWYN AVENUE, NEW PORT RICHEY, FL 34653For SaleMLS ID #TB8517235, Jennifer Helton, ARTISAN REAL ESTATE, INC.. Stellar MLS
- $249,9003 bd2 ba1.2k sqft5724 CASSON AVENUE, NEW PORT RICHEY, FL 34652For SaleMLS ID #W7876574, Kelly Mothershead Timmons, KELLER WILLIAMS REALTY- PALM HARBOR. Stellar MLS
- $290,0003 bd2 ba1.8k sqft4036 SUNRAY DRIVE, HOLIDAY, FL 34691For SaleMLS ID #TB8548168, Ekaterina Osipova, DALTON WADE INC. Stellar MLS
- $249,9003 bd2 ba988 sqft3521 KIMBERLY OAKS DRIVE, HOLIDAY, FL 34691For SaleMLS ID #TB8552753, James Nagy, PA, PALM ISLAND REALTY. Stellar MLS
- $375,0002 bd1 ba945 sqft4911 FLORAMAR TERRACE, NEW PORT RICHEY, FL 34652For SaleMLS ID #TB8451487, Christine Knighton, SMITH & ASSOCIATES REAL ESTATE. Stellar MLS
