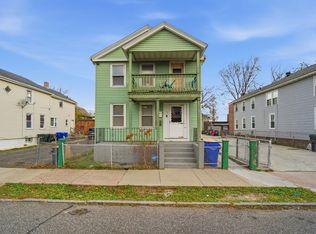
Great investment opportunity! This well-maintained two-family home features two spacious 3-bedroom units, a new roof, updated windows, and a renovated second unit. Reliable tenants with excellent rental history are in place. With plenty of off-street parking, easy access to the highway, and proximity to the casino and numerous amenities, this property is a fantastic investment waiting for you!
Pending
$299,000
49 Fremont St, Springfield, MA 01105
6beds
2,058sqft
Multi Family
Built in 1910
-- sqft lot
$309,200 Zestimate®
$145/sqft
$-- HOA
What's special
Renovated second unitNew roofPlenty of off-street parkingUpdated windows
- 44 days |
- 98 |
- 4 |
Zillow last checked:
Listing updated:
Listed by:
Wileyka Lara 413-273-9068,
Gallagher Real Estate 413-536-7232,
Wileyka Lara 413-273-9068
Source: MLS PIN,MLS#: 73513108
Facts & features
Interior
Bedrooms & bathrooms
- Bedrooms: 6
- Bathrooms: 3
- Full bathrooms: 2
- 1/2 bathrooms: 1
Features
- Basement: Full
- Has fireplace: No
Interior area
- Total structure area: 2,058
- Total interior livable area: 2,058 sqft
- Finished area above ground: 2,058
Property
Parking
- Total spaces: 7
- Parking features: Paved Drive, Off Street
- Uncovered spaces: 7
Lot
- Size: 5,070 Square Feet
Details
- Parcel number: S:05400 P:0030,2585323
- Zoning: R3
Construction
Type & style
- Home type: MultiFamily
- Property subtype: Multi Family
Materials
- Foundation: Brick/Mortar
Condition
- Year built: 1910
Utilities & green energy
- Sewer: Public Sewer
- Water: Public
Community & HOA
Location
- Region: Springfield
Financial & listing details
- Price per square foot: $145/sqft
- Tax assessed value: $188,700
- Annual tax amount: $2,959
- Date on market: 5/5/2026
- Total actual rent: 3350
- Road surface type: Paved
Estimated market value
$309,200
$294,000 - $325,000
$1,472/mo
Price history
| Date | Event | Price |
|---|---|---|
| 5/28/2026 | Pending sale | $299,000$145/sqft |
Source: MLS PIN #73513108 Report a problem | ||
| 5/14/2026 | Contingent | $299,000$145/sqft |
Source: MLS PIN #73513108 Report a problem | ||
| 5/5/2026 | Listed for sale | $299,000+1.4%$145/sqft |
Source: MLS PIN #73513108 Report a problem | ||
| 9/30/2025 | Listing removed | $294,999$143/sqft |
Source: MLS PIN #73394590 Report a problem | ||
| 9/16/2025 | Price change | $294,999-1.3%$143/sqft |
Source: MLS PIN #73394590 Report a problem | ||
| 6/20/2025 | Listed for sale | $299,000$145/sqft |
Source: MLS PIN #73394590 Report a problem | ||
| 4/12/2025 | Listing removed | $299,000$145/sqft |
Source: MLS PIN #73352697 Report a problem | ||
| 4/2/2025 | Listed for sale | $299,000+19.1%$145/sqft |
Source: MLS PIN #73352697 Report a problem | ||
| 12/8/2023 | Sold | $251,000-1.2%$122/sqft |
Source: MLS PIN #73154475 Report a problem | ||
| 9/25/2023 | Price change | $254,000-1.9%$123/sqft |
Source: MLS PIN #73154475 Report a problem | ||
| 9/2/2023 | Listed for sale | $259,000+133.3%$126/sqft |
Source: MLS PIN #73154475 Report a problem | ||
| 2/17/2005 | Sold | $111,000+88.1%$54/sqft |
Source: Public Record Report a problem | ||
| 4/30/1987 | Sold | $59,000$29/sqft |
Source: Public Record Report a problem | ||
Public tax history
| Year | Property taxes | Tax assessment |
|---|---|---|
| 2025 | $2,959 +25.6% | $188,700 +28.6% |
| 2024 | $2,356 +4.1% | $146,700 +10.6% |
| 2023 | $2,263 +1.8% | $132,700 +12.4% |
| 2022 | $2,223 -0.3% | $118,100 +0.1% |
| 2021 | $2,230 -2.7% | $118,000 +0.5% |
| 2020 | $2,293 -2.2% | $117,400 -1.4% |
| 2019 | $2,344 +0.8% | $119,100 +0.8% |
| 2018 | $2,326 +6.5% | $118,200 +6.4% |
| 2017 | $2,184 +13.3% | $111,100 +13.4% |
| 2016 | $1,927 +0.9% | $98,000 +0.9% |
| 2015 | $1,910 -3.2% | $97,100 -3% |
| 2014 | $1,973 +2.7% | $100,100 +2.7% |
| 2013 | $1,922 +3.8% | $97,500 +4.4% |
| 2012 | $1,852 -9% | $93,400 -10.5% |
| 2011 | $2,035 -3.7% | $104,400 -3.7% |
| 2010 | $2,114 -0.7% | $108,400 -8.9% |
| 2009 | $2,129 +12.2% | $119,000 +0.5% |
| 2008 | $1,898 +0.6% | $118,400 +0.7% |
| 2007 | $1,886 +19.3% | $117,600 +26.5% |
| 2006 | $1,581 +7.6% | $93,000 +10.8% |
| 2005 | $1,469 -2.6% | $83,900 +5.7% |
| 2004 | $1,508 +13.4% | $79,400 +15.9% |
| 2003 | $1,330 +2.8% | $68,500 +5.2% |
| 2002 | $1,294 | $65,100 |
Find assessor info on the county website
Monthly payment
Est. payment$--/mo
Payment breakdown
Explore the cost of this home by adjusting the details. Changes won't be saved.All calculations are estimates and provided by Zillow, Inc. for informational purposes only. Actual amounts may vary.
HOA fees may include property taxes on listings classified as Co-Ops. Contact the listing agent and/or owner for fee details.
Mortgage interest rates are dependent on a number of factors, including credit score, down payment, and repayment length. Interest rate data provided by Zillow Group Marketplace, Inc. as of 1/1/1970 from various mortgage lenders with which we have lead or other similar arrangements; the Estimated Payment is an average of those rates.
See how much you could borrow to make a competitive offer.
Climate risks
Neighborhood: South End
Nearby schools
GreatSchools rating
- 7/10White Street SchoolGrades: PK-5Distance: 1.6 mi
- 3/10South End Middle SchoolGrades: 6-8Distance: 0.1 mi
- 2/10High School Of CommerceGrades: 9-12Distance: 0.8 mi
A local agent can set up tours, give advice and negotiate with sellers.


- Massachusetts
- Hampden County
- Springfield
- 01105
- South End
- 49 Fremont St
Nearby cities
Nearby neighborhoods
Nearby zip codes
Other Springfield Topics
