Located near the East Gate of Fort Hood. One side of the duplex is rented, the other side needs some TLC.
Active
$119,900
504 Rhode Island St, Killeen, TX 76541
--beds
--baths
880sqft
Duplex, Multi Family, Multi Family
Built in 1977
-- sqft lot
$-- Zestimate®
$136/sqft
$-- HOA
What's special
- 33 days
- 32
- 2
Likely to sell faster than
Zillow last checked:
Listing updated:
Listed by:
Amy Millsap (254)634-8852,
Morris Real Estate
Source: Central Texas MLS,MLS#: 626875 Originating MLS: Fort Hood Area Association of REALTORS
Facts & features
Interior
Heating
- Window Unit
Cooling
- Wall/Window Unit(s)
Appliances
- Included: Electric Cooktop
- Laundry: None
Features
- Eat-in Kitchen
- Flooring: Laminate
- Attic: None
- Has fireplace: No
- Fireplace features: None
Interior area
- Total interior livable area: 880 sqft
Property
Accessibility
- Accessibility features: None
Features
- Levels: One
- Stories: 1
- Pool features: None
- Fencing: None
- View description: None
- Body of water: None
Lot
- Size: 2,927 Square Feet
Details
- Parcel number: 105127
Construction
Type & style
- Home type: MultiFamily
- Architectural style: Traditional
- Property subtype: Duplex, Multi Family, Multi Family
- Attached to another structure: Yes
Materials
- Frame
- Foundation: Pillar/Post/Pier
- Roof: Metal
Condition
- Resale
- Year built: 1977
Utilities & green energy
- Sewer: Public Sewer
- Water: Public
- Utilities for property: None
Community & HOA
Community
- Subdivision: Camp Add
HOA
- Has HOA: No
Location
- Region: Killeen
Financial & listing details
- Price per square foot: $136/sqft
- Tax assessed value: $61,162
- Annual tax amount: $1,241
- Date on market: 10/1/2026
- Cumulative days on market: 35 days
- Listing agreement: Exclusive Right To Sell
- Listing terms: Cash,Conventional
Estimated market value
Not available
Estimated sales range
Not available
$741/mo
Price history
| Date | Event | Price |
|---|---|---|
| 10/2/2026 | Listed for sale | $119,900$136/sqft |
Source:  Central Texas MLS #626875 Report a problem | ||
| 5/29/2026 | Listing removed | $500$1/sqft |
Source: Zillow Rentals Report a problem | ||
| 5/27/2026 | Price change | $500-16.7%$1/sqft |
Source: Zillow Rentals Report a problem | ||
| 4/3/2026 | Listed for rent | $600$1/sqft |
Source: Zillow Rentals Report a problem | ||
| 3/26/2026 | Listing removed | $600$1/sqft |
Source: Zillow Rentals Report a problem | ||
| 11/18/2025 | Listed for rent | $600$1/sqft |
Source: Zillow Rentals Report a problem | ||
| 11/6/2025 | Listing removed | $600$1/sqft |
Source: Zillow Rentals Report a problem | ||
| 6/23/2025 | Listed for rent | $600$1/sqft |
Source: Zillow Rentals Report a problem | ||
| 9/30/2024 | Listing removed | $600$1/sqft |
Source: Zillow Rentals Report a problem | ||
| 8/15/2024 | Listed for rent | $600+41.2%$1/sqft |
Source: Zillow Rentals Report a problem | ||
| 10/20/2020 | Listing removed | $425 |
Source: Morris Real Estate Report a problem | ||
| 10/14/2020 | Price change | $425-15% |
Source: Morris Real Estate Report a problem | ||
| 10/12/2020 | Listed for rent | $500+33.3%$1/sqft |
Source: Morris Real Estate Report a problem | ||
| 2/4/2019 | Listing removed | $375 |
Source: MORRIS REAL ESTATE Report a problem | ||
| 12/28/2018 | Listed for rent | $375 |
Source: MORRIS REAL ESTATE Report a problem | ||
| 3/14/2018 | Listing removed | $375 |
Source: MORRIS REAL ESTATE Report a problem | ||
| 2/26/2018 | Price change | $375+7.1% |
Source: MORRIS REAL ESTATE Report a problem | ||
| 2/21/2018 | Listed for rent | $350 |
Source: MORRIS REAL ESTATE Report a problem | ||
| 5/10/2014 | Listing removed | $350 |
Source: MORRIS REAL ESTATE Report a problem | ||
| 2/13/2014 | Listed for rent | $350 |
Source: MORRIS REAL ESTATE Report a problem | ||
Public tax history
| Year | Property taxes | Tax assessment |
|---|---|---|
| 2025 | $1,241 +1.8% | $61,162 |
| 2024 | $1,218 +5.2% | $61,162 |
| 2023 | $1,158 +0.7% | $61,162 +11.9% |
| 2022 | $1,150 | $54,648 +58.6% |
| 2021 | -- | $34,456 -7.1% |
| 2020 | $775 +14.9% | $37,085 +38.6% |
| 2019 | $675 +289.7% | $26,748 +306.9% |
| 2018 | $173 +5.5% | $6,573 |
| 2017 | $164 | $6,573 |
| 2016 | $164 +1.1% | $6,573 |
| 2015 | $162 | $6,573 |
| 2014 | $162 | $6,573 |
| 2013 | -- | $6,573 |
| 2012 | -- | $6,573 -55.1% |
| 2011 | -- | $14,633 -2.9% |
| 2010 | -- | $15,069 -2.8% |
| 2009 | -- | $15,505 -2.7% |
| 2008 | -- | $15,940 +0.9% |
| 2007 | -- | $15,805 +0.1% |
| 2006 | -- | $15,795 +25.4% |
| 2005 | -- | $12,595 -8.9% |
| 2004 | -- | $13,821 |
| 2003 | -- | $13,821 |
| 2002 | -- | $13,821 |
| 2001 | -- | $13,821 |
| 2000 | -- | $13,821 |
Find assessor info on the county website
Monthly payment
Est. payment
Payment breakdown
Explore the cost of this home by adjusting the details. Changes won't be saved.Climate risks
Neighborhood: 76541
Nearby schools
Schools provided by the listing agent
- District: Killeen ISD
Source: Central Texas MLS. This data may not be complete. We recommend contacting the local school district to confirm school assignments for this home.


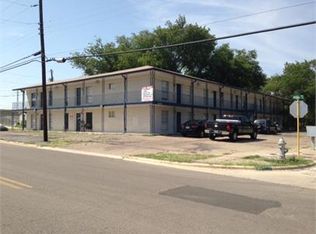

Similar homes
- $120,0003 bd1 ba948 sqft801 S 2nd St, Killeen, TX 76541Active
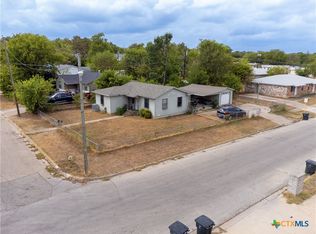
 MLS ID #628379, Ramon Alvarez, All City Real Estate Ltd. Co. Central Texas MLS
- $--3 bd2 ba1.1k sqft2106 Lago Trl, Killeen, TX 76543Auction
 Xome
- $--3 bd2 ba1k sqft707 Colonial Ln, Killeen, TX 76543Auction
 Xome
- $99,9002 bd2 ba968 sqft422 W Green Ave, Killeen, TX 76541Active
 MLS ID #617040, Julissa Ortiz, The Agents Premiere Realty Grp. Central Texas MLS
- $125,0004 bd2 ba1.1k sqft1202 Garth Dr, Killeen, TX 76541ActiveMLS ID #615376, Lisa-Marie McGaughey, McG Homestead Rentals & Sales. Central Texas MLS
- $125,0003 bd2 ba1k sqft610 E Jasper Dr, Killeen, TX 76541ActiveMLS ID #614419, Carolyn Harris, Realty Executives Of Killeen. Central Texas MLS
- $119,9994 bd2 ba1.1k sqft1505 N West S Young Dr, Killeen, TX 76543ActiveMLS ID #625692, Zulma Nevarez, Redbird Realty Llc. Central Texas MLS
- $80,0002 bd1 ba1.1k sqft207 W ANDERSON AVE, Killeen, TX 76541For Sale
 MLS ID #2027884, Michael Evans TREC #816925, BK Real Estate. LERA MLS
- $114,5003 bd1 ba975 sqft1012 San Antonio St, Killeen, TX 76541ActiveMLS ID #621387, Juston Martinez, Texas Ally Real Estate Group. Central Texas MLS
- $137,5003 bd1 ba869 sqft1307 Jackson St, Killeen, TX 76541ActiveMLS ID #627102, Vernon MacHardy, Coldwell Banker Realty. Central Texas MLS
- $159,9003 bd2 ba1.2k sqft604 Wisconsin St, Killeen, TX 76541ActiveMLS ID #606043, Marilyn Metzger, Central Texas H.O.M.E.. Central Texas MLS
- $99,0003 bd1 ba925 sqft824 Southside Dr, Killeen, TX 76541ActiveMLS ID #628472, Jack McLemore, Listing Results, LLC. Central Texas MLS
- $90,0003 bd2 ba960 sqft821 Garner Ave APT 3, Killeen, TX 76541ActiveMLS ID #612384, Sonia Molina, All City Real Estate Ltd. Co. Central Texas MLS
- $104,9002 bd1 ba864 sqft1202 Stewart St, Killeen, TX 76541ActiveMLS ID #624537, Jared English, Congress Realty. Central Texas MLS
- $105,0003 bd1 ba1.1k sqft1104 N 10th St, Killeen, TX 76541ActiveMLS ID #613765, Marisol Cordero, Keller Williams Realty, Waco. Central Texas MLS
- $149,0003 bd2 ba980 sqft4900 TRIMMIER Road, Killeen, TX 76542For Sale
 MLS ID #179789, Audrey Bear, Bear Real Estate Services. HLMLS as distributed by MLS GRID
- $142,0004 bd2 ba1.2k sqft1102 Jackson St, Killeen, TX 76541ActiveMLS ID #621698, Gene Arant, Keller Williams Lake Travis. Central Texas MLS
- $134,9003 bd1 ba1.1k sqft1907 N 22nd St, Killeen, TX 76541ActiveMLS ID #624360, Carmen Colon, Keller Williams Realty. Central Texas MLS
