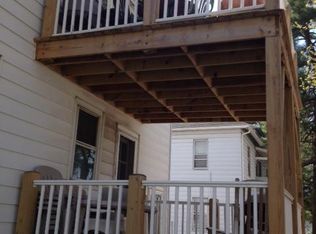
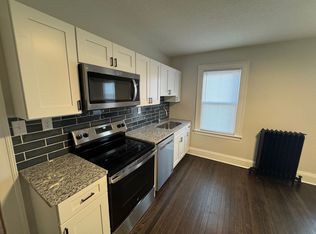
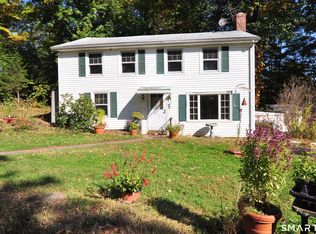
Welcome to this charming West Hartford home filled with character and potential! This home offers a great foundation for its next owner. While some updating and TLC are needed, there's plenty of opportunity to make the space your own and bring your vision to life. Conveniently located in West Hartford with easy access to shopping, dining, highways, and local amenities. Bring your ideas and unlock the potential this home has to offer!
For sale
Price cut: $15K (10/23)
$299,900
51 Nesbit Avenue, West Hartford, CT 06119
3beds
1,394sqft
Single Family Residence
Built in 1917
4,791 Square Feet Lot
$-- Zestimate®
$215/sqft
$-- HOA
What's special
- 50 days
- 3,586
- 346
Likely to sell faster than
Zillow last checked:
Listing updated:
Listed by:
Joshua G. Harris (860)989-1607,
Coldwell Banker Realty 860-231-2600
Source: Smart MLS,MLS#: 24204590
Facts & features
Interior
Bedrooms & bathrooms
- Bedrooms: 3
- Bathrooms: 2
- Full bathrooms: 1
- 1/2 bathrooms: 1
Primary bedroom
- Level: Upper
Bedroom
- Level: Upper
Bedroom
- Level: Upper
Dining room
- Level: Main
Living room
- Level: Main
Heating
- Hot Water, Natural Gas
Cooling
- None
Appliances
- Included: Gas Range, Refrigerator
Features
- Basement: Full,Unfinished
- Attic: None
- Number of fireplaces: 1
Interior area
- Total structure area: 1,394
- Total interior livable area: 1,394 sqft
- Finished area above ground: 1,394
Property
Lot
- Size: 4,791 Square Feet
- Features: Level
Details
- Parcel number: 1902918
- Zoning: RM-3R
Construction
Type & style
- Home type: SingleFamily
- Architectural style: Colonial
- Property subtype: Single Family Residence
Materials
- Vinyl Siding
- Foundation: Concrete Perimeter
- Roof: Shingle
Condition
- New construction: No
- Year built: 1917
Utilities & green energy
- Sewer: Public Sewer
- Water: Public
Community & HOA
HOA
- Has HOA: No
Location
- Region: West Hartford
Financial & listing details
- Price per square foot: $215/sqft
- Tax assessed value: $160,370
- Annual tax amount: $7,501
- Date on market: 9/6/2026
Estimated market value
Not available
Estimated sales range
Not available
Not available
Price history
| Date | Event | Price |
|---|---|---|
| 10/23/2026 | Price change | $299,900-4.8%$215/sqft |
Source:  Smart MLS #24204590 Report a problem | ||
| 10/13/2026 | Price change | $314,900-3.1%$226/sqft |
Source: Smart MLS #24204590 Report a problem | ||
| 10/7/2026 | Price change | $324,900-3%$233/sqft |
Source: Smart MLS #24204590 Report a problem | ||
| 9/24/2026 | Price change | $334,900-4.3%$240/sqft |
Source: Smart MLS #24204590 Report a problem | ||
| 9/6/2026 | Listed for sale | $349,900-4.1%$251/sqft |
Source: Smart MLS #24204590 Report a problem | ||
| 8/21/2026 | Listing removed | $2,632$2/sqft |
Source: Zillow Rentals Report a problem | ||
| 8/6/2026 | Price change | $2,632-3.7%$2/sqft |
Source: Zillow Rentals Report a problem | ||
| 7/15/2026 | Price change | $2,732-5.2%$2/sqft |
Source: Zillow Rentals Report a problem | ||
| 6/30/2026 | Listed for rent | $2,882+3.3%$2/sqft |
Source: Zillow Rentals Report a problem | ||
| 6/28/2026 | Listing removed | $364,900$262/sqft |
Source: Smart MLS #24180309 Report a problem | ||
| 6/22/2026 | Price change | $364,900-3.9%$262/sqft |
Source: Smart MLS #24180309 Report a problem | ||
| 6/12/2026 | Listed for sale | $379,900+24.6%$273/sqft |
Source: Smart MLS #24180309 Report a problem | ||
| 9/21/2025 | Listing removed | $2,790$2/sqft |
Source: Zillow Rentals Report a problem | ||
| 9/2/2025 | Price change | $2,790-2.1%$2/sqft |
Source: Zillow Rentals Report a problem | ||
| 8/25/2025 | Listed for rent | $2,850+3.6%$2/sqft |
Source: Zillow Rentals Report a problem | ||
| 9/28/2024 | Listing removed | $2,750$2/sqft |
Source: Zillow Rentals Report a problem | ||
| 9/7/2024 | Listed for rent | $2,750$2/sqft |
Source: Zillow Rentals Report a problem | ||
| 7/13/2024 | Listing removed | -- |
Source: Zillow Rentals Report a problem | ||
| 6/18/2024 | Price change | $2,750-3.5%$2/sqft |
Source: Zillow Rentals Report a problem | ||
| 6/8/2024 | Listed for rent | $2,850+3.6%$2/sqft |
Source: Zillow Rentals Report a problem | ||
| 3/22/2024 | Listing removed | -- |
Source: Zillow Rentals Report a problem | ||
| 2/29/2024 | Listed for rent | $2,750$2/sqft |
Source: Zillow Rentals Report a problem | ||
| 2/28/2024 | Sold | $305,000-6.4%$219/sqft |
Source: Smart MLS #170616235 Report a problem | ||
| 1/9/2024 | Pending sale | $325,900$234/sqft |
Source: Smart MLS #170616235 Report a problem | ||
| 1/3/2024 | Listed for sale | $325,900+48.1%$234/sqft |
Source: Smart MLS #170616235 Report a problem | ||
| 4/21/2020 | Sold | $220,000+9.5%$158/sqft |
Source: Smart MLS #170265772 Report a problem | ||
| 8/22/2006 | Sold | $201,000$144/sqft |
Source: Smart MLS #G421179 Report a problem | ||
Public tax history
| Year | Property taxes | Tax assessment |
|---|---|---|
| 2025 | $7,181 +5.7% | $160,370 |
| 2024 | $6,792 +3.5% | $160,370 |
| 2023 | $6,562 +0.6% | $160,370 |
| 2022 | $6,524 +0.4% | $160,370 +4.7% |
| 2021 | $6,497 +15.7% | $153,160 +14% |
| 2020 | $5,615 | $134,330 |
| 2019 | $5,615 +3.8% | $134,330 +1.8% |
| 2018 | $5,410 -0.1% | $131,950 |
| 2017 | $5,415 +3.4% | $131,950 -3.4% |
| 2015 | $5,235 +2.5% | $136,640 |
| 2014 | $5,106 +2.9% | $136,640 |
| 2013 | $4,960 +1.5% | $136,640 |
| 2012 | $4,885 -17.4% | $136,640 -8.9% |
| 2011 | $5,916 +2.8% | $150,000 |
| 2010 | $5,757 +2.2% | $150,000 |
| 2009 | $5,631 +1.2% | $150,000 |
| 2008 | $5,564 +57.5% | $150,000 +64.1% |
| 2007 | $3,532 +21.6% | $91,425 +25% |
| 2006 | $2,904 -9.9% | $73,140 |
| 2005 | $3,223 +4.6% | $73,140 |
| 2004 | $3,081 +12% | $73,140 +0.1% |
| 2003 | $2,752 +5.4% | $73,100 -0.1% |
| 2001 | $2,610 -11.3% | $73,140 -25.3% |
| 1998 | $2,943 | $97,930 |
Find assessor info on the county website
Monthly payment
Est. payment
Payment breakdown
Explore the cost of this home by adjusting the details. Changes won't be saved.Climate risks
Neighborhood: 06119
Similar homes
- $299,9003 bd2 ba1.3k sqft224 Abbotsford Avenue, West Hartford, CT 06110For Sale
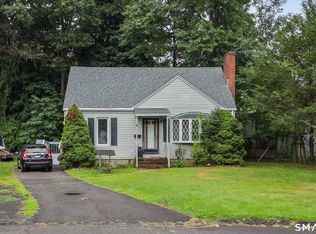
 MLS ID #24203776, James M. Treanor, ERA Treanor Real Estate. Smart MLS
- $300,0003 bd1 ba1.2k sqft30 Oakwood Street, East Hartford, CT 06108For Sale
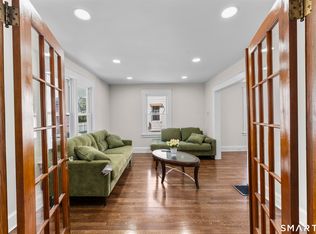 MLS ID #24216677, Leticia Rodriguez, Casa Mia Realty Corporation. Smart MLS
- $319,0003 bd2 ba1.6k sqft110 Plainfield Street, Hartford, CT 06112For Sale
 MLS ID #24211407, Christian Flores, mygoodagent. Smart MLS
- $289,9004 bd2 ba1.6k sqft166 Duncaster Road, Bloomfield, CT 06002For Sale
 MLS ID #24202262, Sharon D. Rispoli, Berkshire Hathaway NE Prop.. Smart MLS
- $330,0003 bd2 ba1.8k sqft50 Yale Street, Hartford, CT 06106For SaleMLS ID #24205220, Alberto Cortes, eXp Realty. Smart MLS
- $239,9002 bd1 ba896 sqftArnoldridge, West Hartford, CT 06119For SaleMLS ID #24216377, Noah Rios-Hoffman, KW Legacy Partners. Smart MLS
- $299,9003 bd1 ba1.4k sqft342 Old Main Street, Rocky Hill, CT 06067For SaleMLS ID #24207282, Tanya Uhelsky, Century 21 AllPoints Realty. Smart MLS
- $310,0003 bd1 ba1.2k sqft103 West Center Street, Manchester, CT 06040For SaleMLS ID #24216202, Holly A. Keating, Agnelli Real Estate. Smart MLS
- $339,0003 bd2 ba1.3k sqft33 Longvue Drive, Wethersfield, CT 06109For SaleMLS ID #24215981, Jim A. Harrington, Carl Guild & Associates. Smart MLS
- $299,9003 bd2 ba1.3k sqft61 Arnott Road, Manchester, CT 06040For SaleMLS ID #24215004, Stacy Anselmo, Coldwell Banker Realty. Smart MLS
- $299,9003 bd3 ba1.3k sqft77 McClintock Street, New Britain, CT 06053For SaleMLS ID #24208282, Mayra J. Perez, Showcase Realty, Inc.. Smart MLS
- $369,0003 bd2 ba978 sqft102 Harding Street, Wethersfield, CT 06109For SaleMLS ID #24215243, Lisa A. Campo, William Raveis Real Estate. Smart MLS
- $319,9993 bd2 ba1.7k sqft49 Brighton Street, New Britain, CT 06053For SaleMLS ID #24202449, Ivan Trenado-Verduzco, Trenado Realty Group. Smart MLS
- $389,9004 bd2 ba1.2k sqft143 Federal Street, West Hartford, CT 06110For SaleMLS ID #24211246, Ashley Paige Pushee, eXp Realty. Smart MLS
- $275,0003 bd2 ba1.2k sqft110 Matianuck Avenue, Windsor, CT 06095For SaleMLS ID #24210521, Kristel Bolden-Gray, eXp Realty. Smart MLS
- $299,9003 bd2 ba1.9k sqft32 Indian Run, Enfield, CT 06082For SaleMLS ID #24208797, Christopher P. Gerber, Naples Realty Group, LLC. Smart MLS
- $250,0003 bd2 ba1.5k sqft26 Rector Street, East Hartford, CT 06108For SaleMLS ID #24215386, Phil Davis, eXp Realty. Smart MLS
- $300,0003 bd1 ba1.2k sqft58 Ashworth Street, Manchester, CT 06040For SaleMLS ID #24195815, Premchand D. Budhram, Vision Real Estate. Smart MLS
- $386,9003 bd1 ba1.1k sqft73 Knollwood Road, West Hartford, CT 06110For SaleMLS ID #24195482, Glenn W. Lawrence, Coldwell Banker Realty. Smart MLS
- $264,9003 bd1 ba912 sqft31 Scott Street, East Hartford, CT 06118For SaleMLS ID #24200185, Jessica Boswell, LPT Realty. Smart MLS
