Investment opportunity in Southeast Albuquerque! This triplex offers an established rental history and a roof that is only 7 years old. One unit is currently vacant and available for showings, providing an opportunity to view the property firsthand. Ideally sold together with the neighboring triplex at 508 Alvarado Drive SE - MLS #1113516, offering investors the opportunity to acquire six rental units in one location. Separate offers may also be considered.
For sale
$265,000
514 Alvarado Dr SE, Albuquerque, NM 87108
3beds
3baths
1,975sqft
Triplex, Multi Family
Built in 1952
-- sqft lot
$-- Zestimate®
$134/sqft
$-- HOA
What's special
- 17 days
- 608
- 49
Zillow last checked:
Listing updated:
Listed by:
Michelle Rohl 505-221-7799,
ERA Summit 505-296-1500,
Holly Rohl 505-440-9807,
ERA Summit
Source: SWMLS,MLS#: 1113517
Facts & features
Interior
Bedrooms & bathrooms
- Bedrooms: 3
- Bathrooms: 3
Heating
- Wall Furnace
Cooling
- Evaporative Cooling, Window Unit(s)
Appliances
- Included: Free-Standing Gas Range, Refrigerator
Features
- Flooring: Laminate
Interior area
- Total structure area: 1,975
- Total interior livable area: 1,975 sqft
Property
Features
- Levels: One
- Stories: 1
- Exterior features: Landscaping
Lot
- Size: 6,969 Square Feet
Details
- Parcel number: 101805614150922914
- Zoning description: MX-L*
Construction
Type & style
- Home type: MultiFamily
- Property subtype: Triplex, Multi Family
Materials
- Stucco
Condition
- Resale
- New construction: No
- Year built: 1952
Utilities & green energy
- Utilities for property: Cable Available, Electricity Connected, Sewer Connected, Water Connected
Green energy
- Energy generation: None
Community & HOA
Community
- Subdivision: Baron Burg Heights
Location
- Region: Albuquerque
Financial & listing details
- Price per square foot: $134/sqft
- Tax assessed value: $139,919
- Annual tax amount: $1,970
- Date on market: 11/4/2026
- Cumulative days on market: 17 days
- Listing terms: Cash,Conventional,FHA,VA Loan
- Total actual rent: 900
- Tenant pays: Electricity, Gas
Estimated market value
Not available
Estimated sales range
Not available
$2,023/mo
Price history
| Date | Event | Price |
|---|---|---|
| 11/4/2026 | Listed for sale | $265,000+96.3%$134/sqft |
Source:  SWMLS #1113517 Report a problem | ||
| 5/24/2019 | Sold | -- |
Source: SWMLS #937061 Report a problem | ||
| 3/18/2019 | Pending sale | $135,000$68/sqft |
Source: Re/Max Exclusive #937061 Report a problem | ||
| 2/7/2019 | Listed for sale | $135,000+3.9%$68/sqft |
Source: Re/Max Exclusive #937061 Report a problem | ||
| 11/1/2018 | Listing removed | $129,900$66/sqft |
Source: Re/Max Exclusive #915968 Report a problem | ||
| 7/6/2018 | Price change | $129,900-3.8%$66/sqft |
Source: Re/Max Exclusive #915968 Report a problem | ||
| 6/9/2018 | Listed for sale | $135,000$68/sqft |
Source: Re/Max Exclusive #915968 Report a problem | ||
| 4/27/2018 | Pending sale | $135,000+28.6%$68/sqft |
Source: Re/Max Exclusive #915968 Report a problem | ||
| 11/4/2016 | Listing removed | $105,000$53/sqft |
Source: Caruso Realty, LLC #865871 Report a problem | ||
| 11/3/2016 | Pending sale | $105,000$53/sqft |
Source: Caruso Realty, LLC #865871 Report a problem | ||
| 11/3/2016 | Listed for sale | $105,000$53/sqft |
Source: Caruso Realty, LLC #865871 Report a problem | ||
| 5/18/2016 | Listing removed | $105,000$53/sqft |
Source: Caruso Realty, LLC #865871 Report a problem | ||
| 5/11/2016 | Listed for sale | $105,000-16.6%$53/sqft |
Source: Caruso Realty, LLC #865871 Report a problem | ||
| 8/26/2014 | Listing removed | $125,900$64/sqft |
Source: Keller Williams Realty #809063 Report a problem | ||
| 3/8/2014 | Listed for sale | $125,900+0.7%$64/sqft |
Source: Keller Williams Realty #809063 Report a problem | ||
| 7/16/2012 | Listing removed | $125,000$63/sqft |
Source: Ammre Inc #722567 Report a problem | ||
| 1/18/2012 | Listed for sale | $125,000$63/sqft |
Source: Ammre Inc #722567 Report a problem | ||
Public tax history
| Year | Property taxes | Tax assessment |
|---|---|---|
| 2025 | $1,971 +3.2% | $46,635 +3% |
| 2024 | $1,910 +1.7% | $45,277 +3% |
| 2023 | $1,879 +3.5% | $43,959 +3% |
| 2022 | $1,815 +3.5% | $42,679 +3% |
| 2021 | $1,754 +1.7% | $41,436 +3% |
| 2020 | $1,726 | $40,230 +20.8% |
| 2019 | -- | $33,309 |
| 2018 | $1,339 -2.8% | $33,309 +3% |
| 2017 | $1,378 +3.1% | $32,339 +3% |
| 2016 | $1,336 -95.7% | $31,397 |
| 2015 | $31,397 +2255% | $31,397 |
| 2014 | $1,333 | $31,397 -23.9% |
| 2013 | $1,333 | $41,265 -6.6% |
| 2012 | -- | $44,196 |
| 2011 | -- | $44,196 |
| 2010 | -- | $44,196 +20.5% |
| 2009 | -- | $36,663 +5.1% |
| 2008 | -- | $34,900 +3% |
| 2007 | -- | $33,884 +3% |
| 2006 | -- | $32,897 +23.1% |
| 2005 | -- | $26,732 +3% |
| 2004 | -- | $25,954 +0% |
| 2003 | -- | $25,953 +3% |
| 2002 | -- | $25,197 -8.8% |
| 2001 | -- | $27,631 +33.3% |
| 2000 | -- | $20,732 |
Find assessor info on the county website
Monthly payment
Est. payment
Payment breakdown
Explore the cost of this home by adjusting the details. Changes won't be saved.Climate risks
Neighborhood: South San Pedro
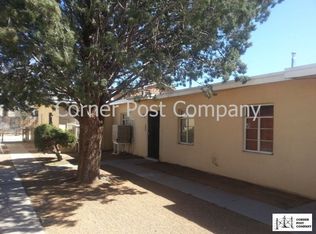
- $285,8001 bd1 ba-- sqft514 Alvarado Dr SE APT 2, Albuquerque, NM 87108Off Market
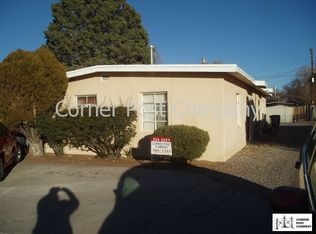
- $285,8001 bd1 ba-- sqft514 Alvarado Dr SE APT 3, Albuquerque, NM 87108Off Market
- $--2 bd2 ba1.1k sqft516 Alvarado Dr SE, Albuquerque, NM 87108Sold

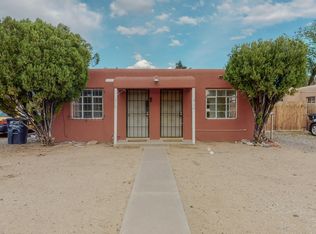
- $221,2002 bd2 ba1.2k sqft516 Alvarado Dr SE #518, Albuquerque, NM 87108Off Market
Similar homes
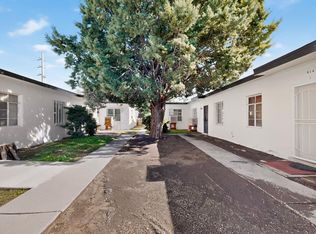
- $265,0003 bd3 ba1.9k sqft508 Alvarado Dr SE, Albuquerque, NM 87108For Sale
 MLS ID #1113516, Michelle Rohl, ERA Summit. SWMLS
- $287,0003 bd2 ba1.8k sqft645 Valencia Dr SE, Albuquerque, NM 87108For Sale
 MLS ID #1113277, Monica Lovato, Realty One of New Mexico. SWMLS
- $319,0006 bd3 ba2.2k sqft1033 Louisiana Blvd SE, Albuquerque, NM 87108For Sale
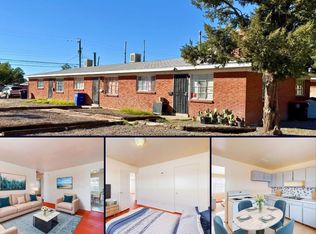 MLS ID #1113762, Jamie Lynn Cline, Precise Real Estate. SWMLS
- $255,0003 bd2 ba1.1k sqft2818 John St SE, Albuquerque, NM 87102For Sale
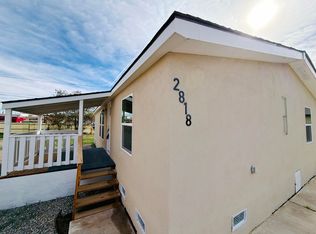 MLS ID #1114291, Ashley M Pendell, Mallory Realty & Investments. SWMLS
