New Roof - December 2025. Interior needs tender love and care. Being sold "As Is". Rental home with long term tenant who is willing to stay, currently paying $1250.00/Month.
For sale by owner
$156,000
5185 NE 22nd Ter, Ocala, FL 34479
3beds
1,454sqft
SingleFamily
Built in 1979
0.38 Acres Lot
$-- Zestimate®
$107/sqft
$-- HOA
Overview
- 29 days
- 983
- 56
Listed by:
Property Owner (352) 622-5240
Facts & features
Interior
Bedrooms & bathrooms
- Bedrooms: 3
- Bathrooms: 2
- Full bathrooms: 2
Heating
- Heat pump, Electric
Cooling
- Central
Appliances
- Included: Range / Oven, Refrigerator
Features
- Flooring: Tile
- Basement: None
- Has fireplace: No
Interior area
- Total interior livable area: 1,454 sqft
Property
Parking
- Parking features: Off-street
Features
- Exterior features: Cement / Concrete
- View description: None
Lot
- Size: 0.38 Acres
Details
- Parcel number: 1498001011
Construction
Type & style
- Home type: SingleFamily
Materials
- Foundation: Slab
- Roof: Shake / Shingle
Condition
- New construction: No
- Year built: 1979
Community & HOA
Location
- Region: Ocala
Financial & listing details
- Price per square foot: $107/sqft
- Tax assessed value: $173,706
- Annual tax amount: $2,726
- Date on market: 9/20/2026
Estimated market value
Not available
Estimated sales range
Not available
$1,606/mo
Price history
| Date | Event | Price |
|---|---|---|
| 9/20/2026 | Listed for sale | $156,000-10.9%$107/sqft |
Source: Owner Report a problem | ||
| 2/22/2026 | Listing removed | -- |
Source: Owner Report a problem | ||
| 2/11/2026 | Listed for sale | $175,000$120/sqft |
Source: Owner Report a problem | ||
Public tax history
| Year | Property taxes | Tax assessment |
|---|---|---|
| 2025 | $2,726 +12% | $123,449 +10% |
| 2024 | $2,434 +10.9% | $112,226 +10% |
| 2023 | $2,193 +4.7% | $102,024 +10% |
| 2022 | $2,096 +13.1% | $92,749 +10% |
| 2021 | $1,853 +18.3% | $84,317 +10% |
| 2020 | $1,566 +4% | $76,652 +6.1% |
| 2019 | $1,506 | $72,227 +3.9% |
| 2018 | $1,506 +10.6% | $69,533 +5% |
| 2017 | $1,362 +7.3% | $66,201 +3.4% |
| 2016 | $1,269 | $64,037 +6.3% |
| 2015 | $1,269 +6.7% | $60,238 +3% |
| 2014 | $1,189 +5.3% | $58,464 +5.5% |
| 2013 | $1,129 -15.2% | $55,404 -19.4% |
| 2012 | $1,332 -4% | $68,765 -4.8% |
| 2011 | $1,388 -9.7% | $72,209 -12.2% |
| 2010 | $1,538 -8% | $82,275 -12.3% |
| 2009 | $1,672 -17.5% | $93,857 -21.7% |
| 2008 | $2,027 +27.2% | $119,926 +32.6% |
| 2007 | $1,593 -9.6% | $90,425 -1.6% |
| 2006 | $1,761 +43.4% | $91,907 +38% |
| 2005 | $1,228 | $66,603 +16.8% |
| 2004 | $1,228 +109% | $57,032 +20.5% |
| 2002 | $588 +13.2% | $47,319 +4.6% |
| 2001 | $519 | $45,218 |
| 2000 | $519 | $45,218 |
Find assessor info on the county website
Monthly payment
Est. payment
Payment breakdown
Explore the cost of this home by adjusting the details. Changes won't be saved.Climate risks
Neighborhood: 34479
Similar homes
- $164,9982 bd1 ba1.1k sqft5820 NE 22ND AVENUE, OCALA, FL 34479For Sale
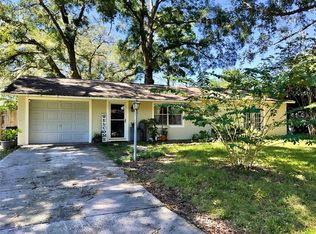
 MLS ID #GC544227, Ashlei Askew, ARIUM REAL ESTATE, LLC. Stellar MLS
- $167,0003 bd2 ba1k sqft4225 NE 25TH AVENUE, OCALA, FL 34479For Sale
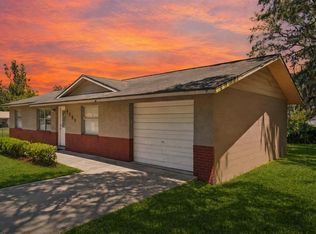 MLS ID #O6451043, Eddie Lopez, EXP REALTY LLC. Stellar MLS
- $149,0003 bd2 ba1.6k sqft6411 NE 22ND COURT, OCALA, FL 34479For Sale
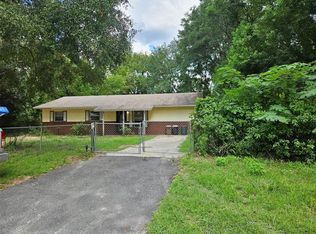 MLS ID #OM731257, Kevin Rollins, HARRIETT DOWNS REAL ESTATE LLC. Stellar MLS
- $146,0002 bd2 ba1.2k sqft4601 NE 20TH AVENUE, OCALA, FL 34479For Sale
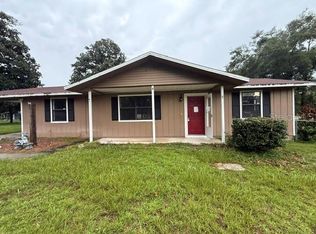 MLS ID #S5156580, Yesenia Carriedo, REALTYCITY INC. Stellar MLS
- $153,0002 bd1 ba1k sqft3312 NE 16TH COURT, OCALA, FL 34479For SaleMLS ID #OM727918, Richard Gailey, GAILEY ENTERPRISES REAL ESTATE. Stellar MLS
- $139,9003 bd1 ba888 sqft2209 NE 36TH STREET, OCALA, FL 34479For SaleMLS ID #O6436338, Ricardo Parada Duarte, MARK SPAIN REAL ESTATE. Stellar MLS
- $194,9003 bd2 ba1.4k sqft1415 NE 53RD STREET, OCALA, FL 34479For SaleMLS ID #TB8535973, CHRISTINA Griffin, GENSTONE REALTY. Stellar MLS
- $147,0002 bd2 ba858 sqft2220 NW 1ST AVENUE, OCALA, FL 34475For SaleMLS ID #OM733980, Kimberly Black, REDI REAL ESTATE, LLC. Stellar MLS
- $215,0003 bd2 ba1k sqft4305 NE 25TH AVENUE, OCALA, FL 34479For SaleMLS ID #R4912141, Patrick Westervelt, LLC, VINTAGE REALTY SOLUTIONS. Stellar MLS
- $160,0002 bd1 ba816 sqft630 NE 9TH AVENUE, OCALA, FL 34470For SaleMLS ID #OM733836, Ivy Moya, PLATINUM HOMES AND LAND REALTY. Stellar MLS
- $190,0003 bd1 ba1.2k sqft1474 NE 59TH STREET, OCALA, FL 34479For SaleMLS ID #OM725858, Madison Allen, HOMERUN REALTY. Stellar MLS
- $209,9003 bd2 ba1.1k sqft2309 NE 38TH STREET, OCALA, FL 34479For SaleMLS ID #OM732626, Randy Barnes, RE/MAX PREMIER REALTY. Stellar MLS
- $170,0003 bd1 ba1k sqft613 NE 8TH AVENUE, OCALA, FL 34470For SaleMLS ID #OM733819, Ivy Moya, PLATINUM HOMES AND LAND REALTY. Stellar MLS
- $219,0003 bd2 ba1k sqft2831 NE 35TH STREET, OCALA, FL 34479For SaleMLS ID #OM733148, Aimee Deen, KELLER WILLIAMS CORNERSTONE RE. Stellar MLS
- $159,0003 bd1 ba1.4k sqft2507 N MAGNOLIA AVENUE, OCALA, FL 34475For SaleMLS ID #G5111930, Veronica Jauregui, LPT REALTY, LLC. Stellar MLS
- $225,0002 bd2 ba1k sqft3820 NE 16TH COURT, OCALA, FL 34479For SaleMLS ID #OM732911, Jenni Kennedy, REAL BROKER, LLC. Stellar MLS
- $175,0003 bd2 ba1.6k sqft833 NE 28TH STREET, OCALA, FL 34470For SaleMLS ID #O6390984, Tony Tate, PLLC, LPT REALTY, LLC. Stellar MLS
- $215,0003 bd2 ba1k sqft2305 NE 38TH STREET, OCALA, FL 34479For SaleMLS ID #O6433191, Armando Cifuentes, REAL ESTATE OF FLORIDA. Stellar MLS
- $125,0003 bd1 ba928 sqft804 NE 9TH AVENUE, OCALA, FL 34470For SaleMLS ID #OM733869, Ivy Moya, PLATINUM HOMES AND LAND REALTY. Stellar MLS
- $210,0003 bd2 ba1k sqft2404 NE 32ND PLACE, OCALA, FL 34479For SaleMLS ID #OM728728, Tiffany Bess, DALTON WADE INC. Stellar MLS
