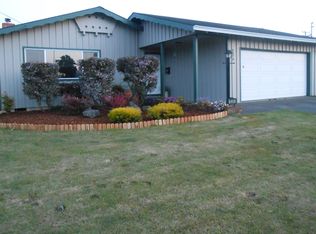
Welcome to this three bedroom, two bath home tucked away at the end of a cul-de-sac. The open floor plan creates a comfortable flow, perfect for gathering with family and friends! The living room features beautiful hardwood floors, cozy woodstove and a sliding glass door that opens to a private backyard with a deck.
For sale
$455,000
5208 Meadow Ct, Eureka, CA 95503
3beds
2baths
1,422sqft
Single Family Residence
Built in 1972
5,662 Square Feet Lot
$443,800 Zestimate®
$320/sqft
$-- HOA
What's special
Cozy woodstoveComfortable flowEnd of a cul-de-sacOpen floor planBeautiful hardwood floorsSliding glass door
- 14 days
- 919
- 49
Likely to sell faster than
Zillow last checked:
Listing updated:
Listed by:
Nikki Arnold mark@benchmarkrealtygroup.com,
Benchmark Realty Group/ Mb
Source: HBMLS,MLS#: 273613
Facts & features
Interior
Bedrooms & bathrooms
- Bedrooms: 3
- Bathrooms: 2
Heating
- Forced Air, Wood Stove
Appliances
- Included: Gas, Microwave, Disposal, Dishwasher, Washer, Dryer
- Laundry: In Garage, Washer Hookup
Features
- Ceiling Fan(s), Breakfast Bar
- Flooring: Hardwood, Laminate
- Has fireplace: Yes
Interior area
- Total structure area: 1,422
- Total interior livable area: 1,422 sqft
Video & virtual tour
Property
Parking
- Total spaces: 2
- Parking features: Garage
- Garage spaces: 2
Features
- Patio & porch: Deck
- Fencing: Partial
Lot
- Size: 5,662 Square Feet
- Dimensions: 111 x 56
Details
- Parcel number: 302071059
Construction
Type & style
- Home type: SingleFamily
- Property subtype: Single Family Residence
Materials
- Foundation: Concrete Perimeter
Condition
- New construction: No
- Year built: 1972
Utilities & green energy
- Electric: 220 Volts in Laundry
- Water: Public
Community & HOA
Location
- Region: Eureka
Financial & listing details
- Price per square foot: $320/sqft
- Tax assessed value: $276,320
- Date on market: 10/26/2026
Estimated market value
$443,800
$422,000 - $466,000
$2,268/mo
Price history
| Date | Event | Price |
|---|---|---|
| 10/26/2026 | Listed for sale | $455,000+106.8%$320/sqft |
Source:  HBMLS #273613 Report a problem | ||
| 4/3/2013 | Sold | $220,000+109.5%$155/sqft |
Source: HBMLS #236858 Report a problem | ||
| 12/12/2012 | Listing removed | $1,500$1/sqft |
Source: MacMullin & Company Report a problem | ||
| 12/8/2012 | Price change | $1,500+7.1%$1/sqft |
Source: MacMullin & Company Report a problem | ||
| 11/30/2012 | Listed for rent | $1,400$1/sqft |
Source: MacMullin & Company Report a problem | ||
| 11/21/2011 | Listing removed | $1,400$1/sqft |
Source: MacMullin & Company Report a problem | ||
| 11/9/2011 | Price change | $1,400-12.5%$1/sqft |
Source: MacMullin & Company Report a problem | ||
| 10/14/2011 | Listed for rent | $1,600$1/sqft |
Source: MacMullin & Company Report a problem | ||
| 7/24/1998 | Sold | $105,000$74/sqft |
Source: Public Record Report a problem | ||
Public tax history
| Year | Property taxes | Tax assessment |
|---|---|---|
| 2026 | -- | $276,320 +2% |
| 2025 | $2,952 +5.2% | $270,903 +2% |
| 2024 | $2,807 +3.2% | $265,592 +2% |
| 2023 | $2,720 -5.3% | $260,385 +2% |
| 2022 | $2,873 +7.1% | $255,281 +2% |
| 2021 | $2,682 +2.8% | $250,276 +1% |
| 2020 | $2,609 +2.2% | $247,711 +2% |
| 2019 | $2,553 +1.6% | $242,855 +2% |
| 2018 | $2,512 +0.2% | $238,094 +2% |
| 2017 | $2,508 +0.1% | $233,426 +2% |
| 2016 | $2,506 +8.1% | $228,850 +1.5% |
| 2015 | $2,319 | $225,413 +2% |
| 2014 | $2,319 | $220,998 +68.6% |
| 2012 | -- | $131,040 +2% |
| 2011 | -- | $128,472 +0.8% |
| 2010 | -- | $127,513 -0.2% |
| 2009 | -- | $127,817 +2% |
| 2008 | -- | $125,312 +2% |
| 2007 | -- | $122,856 +2% |
| 2006 | -- | $120,448 +2% |
| 2005 | -- | $118,087 +2% |
| 2004 | -- | $115,773 +1.9% |
| 2003 | -- | $113,653 +2% |
| 2002 | -- | $111,425 +2% |
| 2001 | -- | $109,241 +2% |
| 2000 | -- | $107,100 |
Find assessor info on the county website
Monthly payment
Est. payment
Payment breakdown
Explore the cost of this home by adjusting the details. Changes won't be saved.Climate risks
Neighborhood: 95503
Similar homes
- $479,0003 bd2 ba1.3k sqft4877 Allen Ct, Eureka, CA 95503For Sale

 MLS ID #273586, Stephanie Coffey. HBMLS
- $464,0003 bd2 ba1.4k sqft33 Logan Ln, Eureka, CA 95503For Sale
 MLS ID #272838, Victoria Copeland. HBMLS
- $459,0003 bd2 ba1.5k sqft4519 Excelsior Rd, Eureka, CA 95503For Sale
 MLS ID #273425, Michelle Ann Cardoza. HBMLS
- $449,0003 bd2 ba1.7k sqft3364 High St, Eureka, CA 95503For Sale
 MLS ID #OC26216015, Linda Pitarra, REMAX Professionals. CRMLS
- $445,0003 bd2 ba1.3k sqft745 Burrill St, Eureka, CA 95503For SaleMLS ID #272617, April L Wolfe. HBMLS
- $449,0004 bd2 ba1.5k sqft2908 California St, Eureka, CA 95501For SaleMLS ID #273655, Thomas Walker. HBMLS
- $425,0003 bd2 ba1.6k sqft2152 Serenity Ln, Eureka, CA 95503For SaleMLS ID #273381, Jill Hansen-Rice. HBMLS
- $399,9003 bd2 ba1.2k sqft916 Allard Ave, Eureka, CA 95503For SaleMLS ID #273145, Brian Dunlap. HBMLS
- $445,0003 bd1 ba1.5k sqft1640 California St, Eureka, CA 95501For SaleMLS ID #273668, Victoria Foersterling. HBMLS
- $369,9003 bd2 ba1.6k sqft1330 Muncie St, Eureka, CA 95503For SaleMLS ID #273542, Joanie Frederick. HBMLS
- $499,0003 bd2 ba1.5k sqft4692 Cummings Rd, Eureka, CA 95503For SaleMLS ID #270242, Lauren Smith. HBMLS
- $399,0002 bd2 ba1.5k sqft1431 Leslie Rd, Eureka, CA 95503For SaleMLS ID #273524, Sally Conley. HBMLS
- $610,0003 bd2 ba2k sqft4648 Campton Rd, Eureka, CA 95503For SaleMLS ID #273637, Darrell Burlison. HBMLS
- $499,0004 bd3 ba2k sqft4951 Lundblade Dr, Eureka, CA 95503For SaleMLS ID #272480, Malachi Herrera. HBMLS
- $445,0004 bd2 ba2k sqft721 Burrill St, Eureka, CA 95503For SaleMLS ID #272735, Tom Hunt. HBMLS
- $510,0004 bd2 ba1.9k sqft4734 Campton Rd, Eureka, CA 95503For SaleMLS ID #273356, Christine Elizabeth Tyson. HBMLS
- $435,0003 bd2 ba1.3k sqft2190 Foxwood Dr, Eureka, CA 95503For SaleMLS ID #272472, Victoria Foersterling. HBMLS
- $399,0003 bd2 ba1.5k sqft6241 Pryor St, Eureka, CA 95503For SaleMLS ID #273346, Don Chin. HBMLS
- $425,0003 bd2 ba1.2k sqft2185 Foxwood Dr, Eureka, CA 95503For SaleMLS ID #272826, Heather Bergen. HBMLS
