Fantastic Multi-Unit Opportunity in Chicago! Welcome to this recently updated, spacious 3-flat. Each of the three generously sized units features 3 bedrooms and 1 full bathroom, with bright, sun-filled living spaces, inviting layouts, and eat-in kitchens featuring beautiful granite countertops. NEW ROOF, adding value and peace of mind for the next owner. Enjoy a spacious backyard with plenty of room for outdoor gatherings, a convenient rear parking pad, and security gates at both the front and rear of the property. Each tenants pays their own utilities. Sold As-is!
New
$389,900
5224 S Paulina St, Chicago, IL 60609
9beds
--sqft
Multi Family
Built in 1900
-- sqft lot
$384,800 Zestimate®
$--/sqft
$-- HOA
What's special
Inviting layoutsConvenient rear parking padEat-in kitchensBeautiful granite countertopsBright sun-filled living spacesRecently updatedNew roof
- 2 days
- 94
- 5
Zillow last checked:
Listing updated:
Listed by:
Danica Matos (630)870-1000,
Smart Home Realty
Source: MRED as distributed by MLS GRID,MLS#: 12791714
Facts & features
Interior
Bedrooms & bathrooms
- Bedrooms: 9
- Bathrooms: 3
- Full bathrooms: 3
Heating
- Forced Air
Features
- Basement: None
Property
Parking
- Total spaces: 3
- Parking features: Alley Access, Yes, Owned
Lot
- Size: 3,125 Square Feet
- Dimensions: 25X125
Details
- Parcel number: 20074130340000
- Zoning: MULTI
- Special conditions: None
Construction
Type & style
- Home type: MultiFamily
- Property subtype: Multi Family
Materials
- Brick
Condition
- New construction: No
- Year built: 1900
- Major remodel year: 2024
Utilities & green energy
- Sewer: Public Sewer
- Water: Lake Michigan
Community & HOA
Location
- Region: Chicago
Financial & listing details
- Tax assessed value: $340,010
- Annual tax amount: $5,646
- Date on market: 10/23/2026
- Ownership: Fee Simple
Estimated market value
$384,800
$366,000 - $404,000
$2,506/mo
Price history
| Date | Event | Price |
|---|---|---|
| 10/23/2026 | Listed for sale | $389,900+13.8% |
Source:  MRED as distributed by MLS GRID #12791714 Report a problem | ||
| 7/26/2023 | Sold | $342,500-4.6% |
Source: MRED as distributed by MLS GRID #11781807 Report a problem | ||
| 5/26/2023 | Pending sale | $359,000 |
Source: MRED as distributed by MLS GRID #11781807 Report a problem | ||
| 5/12/2023 | Listed for sale | $359,000-4.3% |
Source: MRED as distributed by MLS GRID #11781807 Report a problem | ||
| 4/6/2023 | Listing removed | -- |
Source: MRED as distributed by MLS GRID #11638015 Report a problem | ||
| 3/18/2023 | Pending sale | $375,000 |
Source: MRED as distributed by MLS GRID #11638015 Report a problem | ||
| 1/5/2023 | Price change | $375,000-3.8% |
Source: MRED as distributed by MLS GRID #11638015 Report a problem | ||
| 10/29/2022 | Price change | $390,000-7.1% |
Source: MRED as distributed by MLS GRID #11638015 Report a problem | ||
| 9/25/2022 | Listed for sale | $420,000+2233.3% |
Source: MRED as distributed by MLS GRID #11638015 Report a problem | ||
| 3/1/2016 | Sold | $18,000-87.9% |
Source: Public Record Report a problem | ||
| 3/14/2012 | Listing removed | $148,999 |
Source: Baird & Warner Real Estate #07884621 Report a problem | ||
| 11/25/2011 | Listed for sale | $148,999+2.8% |
Source: Baird & Warner Real Estate #07884621 Report a problem | ||
| 2/11/2011 | Listing removed | $145,000 |
Source: FreedomSoft LLLP Report a problem | ||
| 1/8/2011 | Listed for sale | $145,000+437% |
Source: FreedomSoft LLLP Report a problem | ||
| 8/12/2009 | Sold | $27,000-90.8% |
Source: Public Record Report a problem | ||
| 10/31/2006 | Sold | $292,000+812.5% |
Source: Public Record Report a problem | ||
| 5/22/2002 | Sold | $32,000+45.5% |
Source: Public Record Report a problem | ||
| 4/19/2002 | Sold | $22,000 |
Source: Public Record Report a problem | ||
Public tax history
| Year | Property taxes | Tax assessment |
|---|---|---|
| 2024 | $6,861 +439.2% | $34,001 +466.8% |
| 2023 | $1,273 +2.6% | $5,999 |
| 2022 | $1,241 +2.9% | $5,999 |
| 2021 | $1,206 -19.5% | $5,999 -10.2% |
| 2020 | $1,498 -3.5% | $6,680 -13% |
| 2019 | $1,553 +1.7% | $7,679 |
| 2018 | $1,527 -52.5% | $7,679 -48.2% |
| 2017 | $3,212 +7.5% | $14,824 |
| 2016 | $2,989 +9.2% | $14,824 |
| 2015 | $2,736 +9.2% | $14,824 +10.7% |
| 2014 | $2,505 +2% | $13,396 |
| 2013 | $2,456 +1.3% | $13,396 |
| 2012 | $2,423 -14.4% | $13,396 -22.8% |
| 2011 | $2,832 -0.5% | $17,361 |
| 2010 | $2,846 +4.3% | $17,361 |
| 2009 | $2,729 -2.5% | $17,361 -10.3% |
| 2008 | $2,797 +0.9% | $19,356 |
| 2007 | $2,772 -1.1% | $19,356 |
| 2006 | $2,802 +159.2% | $19,356 +192.7% |
| 2005 | $1,081 +0.1% | $6,614 |
| 2004 | $1,080 +288.2% | $6,614 +279.9% |
| 2003 | $278 -69.4% | $1,741 -65.3% |
| 2002 | $910 +3.7% | $5,019 |
| 2001 | $878 +177.4% | $5,019 |
| 2000 | $317 -3.8% | $5,019 +65.5% |
| 1999 | $329 | $3,033 |
Find assessor info on the county website
Monthly payment
Est. payment
Payment breakdown
Explore the cost of this home by adjusting the details. Changes won't be saved.Climate risks
Neighborhood: Back of the Yards
Nearby schools

Similar homes
- $429,9008 bd3 ba-- sqft1845 W Garfield Blvd, Chicago, IL 60636New
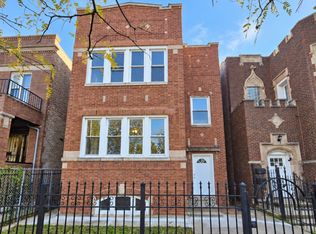 MLS ID #12790903, Lilia Lluvia, Properties Indeed Corp. MRED as distributed by MLS GRID
- $470,0009 bd4 ba-- sqft5005 S Paulina St, Chicago, IL 60609Active
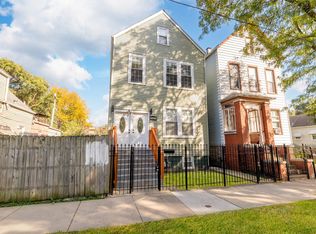 MLS ID #12785000, Victor Naranjo, Realty of America, LLC. MRED as distributed by MLS GRID
- $370,0007 bd4 ba-- sqft5320 S Laflin St, Chicago, IL 60609Price Change
 MLS ID #12759489, Jaiva Birch, Century 21 IMPACT. MRED as distributed by MLS GRID
- $399,0008 bd4 ba-- sqft4812 S Elizabeth St, Chicago, IL 60609Active
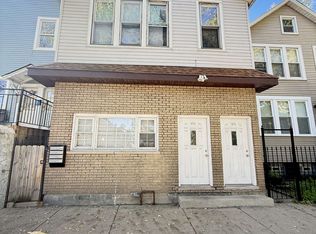 MLS ID #12757721, Mago Chacon, Century 21 S.G.R., Inc.. MRED as distributed by MLS GRID
