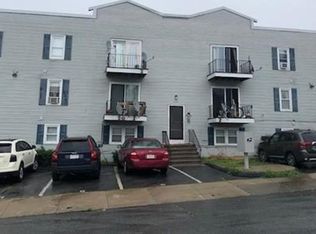
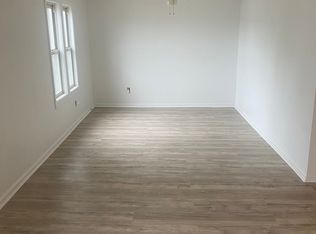
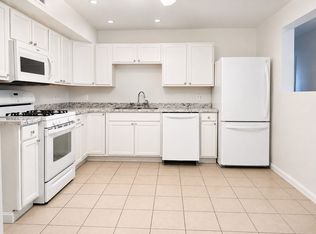
Newly Renovated 3-Bedroom Condo – Investor Opportunity! Don’t miss this opportunity to own a newly renovated 3-bedroom condo! This unit features a gas stove, refrigerator, and washer/dryer hookups for added convenience. Ideal for investors or buyers seeking a property with potential. Please note: The condominium community is majority investor-owned. Financing is subject to lender approval and condominium association eligibility requirements.
For sale
Price cut: $10K (10/27)
$245,000
526 3rd St APT 6, Fall River, MA 02721
3beds
1,001sqft
Condominium
Built in 1985
-- sqft lot
$243,300 Zestimate®
$245/sqft
$300/mo HOA
What's special
Newly renovatedGas stove
- 20 days
- 282
- 17
Zillow last checked:
Listing updated:
Listed by:
Shanise Barrett 774-417-2579,
Vicente Realty, LLC 508-944-3144,
Shanise Barrett 774-417-2579
Source: MLS PIN,MLS#: 73591468
Facts & features
Interior
Bedrooms & bathrooms
- Bedrooms: 3
- Bathrooms: 1
- Full bathrooms: 1
Heating
- Forced Air
Cooling
- Window Unit(s)
Appliances
- Included: Range, Dishwasher, Refrigerator
Features
- Has basement: No
- Has fireplace: No
Interior area
- Total structure area: 1,001
- Total interior livable area: 1,001 sqft
- Finished area above ground: 1,001
Property
Parking
- Total spaces: 1
- Parking features: Off Street, Assigned
- Uncovered spaces: 1
Details
- Parcel number: FALLM0I11B0000L1406
- Zoning: Residentia
Construction
Type & style
- Home type: Condo
- Property subtype: Condominium
- Attached to another structure: Yes
Condition
- Year built: 1985
Utilities & green energy
- Sewer: Public Sewer
- Water: Public
Community & HOA
Community
- Features: Public Transportation, Shopping, Highway Access
HOA
- Services included: Insurance, Maintenance Grounds, Snow Removal, Reserve Funds
- HOA fee: $300 monthly
Location
- Region: Fall River
Financial & listing details
- Price per square foot: $245/sqft
- Tax assessed value: $145,400
- Annual tax amount: $1,669
- Date on market: 10/15/2026
- Listing terms: Lender Approval Required
Estimated market value
$243,300
$231,000 - $255,000
$1,925/mo
Price history
| Date | Event | Price |
|---|---|---|
| 10/27/2026 | Price change | $245,000-3.9%$245/sqft |
Source: MLS PIN #73591468 Report a problem | ||
| 10/15/2026 | Listed for sale | $255,000+51.8%$255/sqft |
Source: MLS PIN #73591468 Report a problem | ||
| 3/11/2025 | Sold | $168,000-23.3%$168/sqft |
Source: Public Record Report a problem | ||
| 6/12/2024 | Listing removed | $219,000$219/sqft |
Source: MLS PIN #73202001 Report a problem | ||
| 3/7/2024 | Contingent | $219,000$219/sqft |
Source: MLS PIN #73202001 Report a problem | ||
| 2/13/2024 | Listed for sale | $219,000+41.3%$219/sqft |
Source: MLS PIN #73202001 Report a problem | ||
| 5/31/2023 | Sold | $155,000-3.1%$155/sqft |
Source: MLS PIN #73068901 Report a problem | ||
| 5/2/2023 | Price change | $160,000-3%$160/sqft |
Source: MLS PIN #73068901 Report a problem | ||
| 2/21/2023 | Price change | $165,000-2.8%$165/sqft |
Source: MLS PIN #73068901 Report a problem | ||
| 1/24/2023 | Price change | $169,741-10.6%$170/sqft |
Source: MLS PIN #73068901 Report a problem | ||
| 1/7/2023 | Listed for sale | $189,900+40.7%$190/sqft |
Source: MLS PIN #73068901 Report a problem | ||
| 4/29/2022 | Sold | $135,000+4.9%$135/sqft |
Source: MLS PIN #72948561 Report a problem | ||
| 3/3/2022 | Listed for sale | $128,700+11.9%$129/sqft |
Source: MLS PIN #72948561 Report a problem | ||
| 10/6/2004 | Sold | $115,000$115/sqft |
Source: Public Record Report a problem | ||
Public tax history
| Year | Property taxes | Tax assessment |
|---|---|---|
| 2025 | $1,711 -11.5% | $149,400 -11.2% |
| 2024 | $1,934 +5.3% | $168,300 +12.5% |
| 2023 | $1,836 +5.1% | $149,600 +8.1% |
| 2022 | $1,747 +4.5% | $138,400 +14.6% |
| 2021 | $1,671 +13.3% | $120,800 +18.3% |
| 2020 | $1,475 +2.9% | $102,100 +3.9% |
| 2019 | $1,433 +6.2% | $98,300 +6.5% |
| 2018 | $1,349 +4.4% | $92,300 |
| 2017 | $1,292 +5.8% | $92,300 +3% |
| 2016 | $1,221 +1.9% | $89,600 -2.2% |
| 2015 | $1,198 -3.6% | $91,600 -7.3% |
| 2014 | $1,243 +3.8% | $98,800 -1.6% |
| 2013 | $1,198 +3.9% | $100,400 -4.4% |
| 2012 | $1,153 +4.2% | $105,000 -14.2% |
| 2010 | $1,106 +9.3% | $122,400 -2.5% |
| 2009 | $1,012 +3% | $125,600 -2% |
| 2008 | $983 +6.2% | $128,100 -0.6% |
| 2007 | $926 | $128,900 |
Find assessor info on the county website
Monthly payment
Est. payment
Payment breakdown
Explore the cost of this home by adjusting the details. Changes won't be saved.Climate risks
Neighborhood: Corky Row

Similar homes
- $245,0003 bd1 ba912 sqft177 Nashua St APT 6, Fall River, MA 02721For Sale
 MLS ID #73591992, Holly McCombs Team, Lamacchia Realty, Inc.. MLS PIN
- $259,0003 bd1 ba936 sqftThe Arbors, Fall River, MA 02721For Sale
 MLS ID #73568579, Zechariah Stockbarger, Keller Williams South Watuppa. MLS PIN
- $170,0003 bd1 ba941 sqft526 3rd St APT 3, Fall River, MA 02721For Sale
 MLS ID #73586713, Jamal Adrien, Zander Realty Group. MLS PIN
- $262,5002 bd1 ba1k sqftSt. Louis Schoolhouse, Fall River, MA 02721For Sale
 MLS ID #73527261, Doris Arruda, Pelletier Realty, Inc.. MLS PIN
- $195,0001 bd1 ba660 sqftWaterview Condominiums, Warren, RI 02885For Sale
 MLS ID #1425942, Matt Antonio, Corcoran Chart House Realty. StateWide MLS RI
