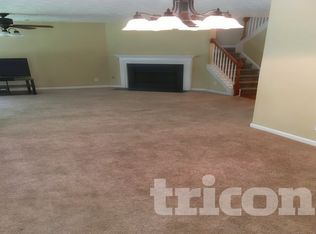
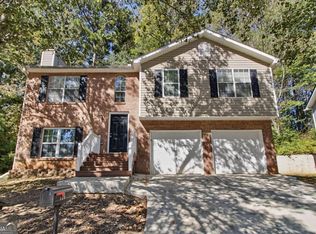
Beautiful home with so much to offer! Move-in ready and waiting for its next owner to make it their own. Don't miss your chance to make this home yours-it won't last long!
Active
Price cut: $2.5K (11/13)
$232,500
554 Arbor Ridge Dr, Stone Mountain, GA 30087
3beds
1,936sqft
Single Family Residence
Built in 2001
0.38 Acres Lot
$232,400 Zestimate®
$120/sqft
$-- HOA
What's special
- 23 days
- 2,254
- 231
Likely to sell faster than
Zillow last checked:
Listing updated:
Listed by:
Cassady Caven 704-903-3132,
eXp Realty
Source: GAMLS,MLS#: 10878686
Facts & features
Interior
Bedrooms & bathrooms
- Bedrooms: 3
- Bathrooms: 3
- Full bathrooms: 2
- 1/2 bathrooms: 1
Rooms
- Room types: Family Room
Heating
- Central, Other
Cooling
- Central Air
Appliances
- Included: Other
- Laundry: Other
Features
- Other
- Flooring: Tile
- Basement: None
- Number of fireplaces: 1
Interior area
- Total structure area: 1,936
- Total interior livable area: 1,936 sqft
- Finished area above ground: 1,936
- Finished area below ground: 0
Property
Parking
- Parking features: Garage
- Has garage: Yes
Features
- Levels: Two
- Stories: 2
Lot
- Size: 0.38 Acres
- Features: Other
Details
- Parcel number: 18 031 02 157
Construction
Type & style
- Home type: SingleFamily
- Architectural style: Traditional
- Property subtype: Single Family Residence
Materials
- Other
- Roof: Other
Condition
- Resale
- New construction: No
- Year built: 2001
Utilities & green energy
- Sewer: Public Sewer
- Water: Public
- Utilities for property: Other
Community & HOA
Community
- Features: None
- Subdivision: Arbor Glen
HOA
- Has HOA: No
- Services included: Other
Location
- Region: Stone Mountain
Financial & listing details
- Price per square foot: $120/sqft
- Tax assessed value: $269,000
- Annual tax amount: $5,168
- Date on market: 10/24/2026
- Cumulative days on market: 23 days
- Listing agreement: Exclusive Right To Sell
Estimated market value
$232,400
$221,000 - $244,000
$2,095/mo
Price history
| Date | Event | Price |
|---|---|---|
| 11/13/2026 | Price change | $232,500-1.1%$120/sqft |
Source:  GAMLS #10878686 Report a problem | ||
| 11/6/2026 | Price change | $235,000-2.1%$121/sqft |
Source: GAMLS #10878686 Report a problem | ||
| 10/30/2026 | Price change | $240,000-2%$124/sqft |
Source: GAMLS #10878686 Report a problem | ||
| 10/24/2026 | Listed for sale | $245,000+260.3%$127/sqft |
Source: GAMLS #10878686 Report a problem | ||
| 5/5/2023 | Listing removed | -- |
Source: Zillow Rentals Report a problem | ||
| 5/1/2023 | Listed for rent | $1,950+8.3%$1/sqft |
Source: Zillow Rentals Report a problem | ||
| 3/24/2022 | Listing removed | -- |
Source: Zillow Rental Manager Report a problem | ||
| 3/6/2022 | Listed for rent | $1,800$1/sqft |
Source: Zillow Rental Manager Report a problem | ||
| 12/15/2010 | Sold | $68,000-2.9%$35/sqft |
Source: Public Record Report a problem | ||
| 9/16/2010 | Pending sale | $70,000$36/sqft |
Source: Keller Williams Realty Premier Atlanta #4085780 Report a problem | ||
| 8/23/2010 | Price change | $70,000-6.7%$36/sqft |
Source: Keller Williams Realty Premier Atlanta #4085780 Report a problem | ||
| 8/6/2010 | Price change | $75,000-6.3%$39/sqft |
Source: Keller Williams Realty Premier Atlanta #4085780 Report a problem | ||
| 7/25/2010 | Price change | $80,000-5.9%$41/sqft |
Source: Keller Williams Realty Premier Atlanta #4085780 Report a problem | ||
| 6/26/2010 | Listed for sale | $85,000-44.8%$44/sqft |
Source: Keller Williams Realty Premier Atlanta #4085780 Report a problem | ||
| 8/2/2007 | Sold | $154,000+15.8%$80/sqft |
Source: Public Record Report a problem | ||
| 8/5/2004 | Sold | $133,000+10.2%$69/sqft |
Source: Public Record Report a problem | ||
| 11/18/2003 | Sold | $120,700-9.1%$62/sqft |
Source: Public Record Report a problem | ||
| 6/13/2001 | Sold | $132,800$69/sqft |
Source: Public Record Report a problem | ||
Public tax history
| Year | Property taxes | Tax assessment |
|---|---|---|
| 2025 | $5,168 +1.4% | $107,600 +1.5% |
| 2024 | $5,095 +2.8% | $105,960 +2% |
| 2023 | $4,954 +6.9% | $103,920 +6.6% |
| 2022 | $4,636 +34.9% | $97,520 +38.9% |
| 2021 | $3,437 +6.8% | $70,200 +7.6% |
| 2020 | $3,219 +8.7% | $65,240 +9.9% |
| 2019 | $2,961 +6.2% | $59,360 +10.3% |
| 2018 | $2,789 +4.6% | $53,800 +2.6% |
| 2017 | $2,668 +12.4% | $52,440 +14.8% |
| 2016 | $2,374 | $45,680 +79.3% |
| 2014 | $2,374 | $25,480 |
| 2013 | -- | $25,480 -15.1% |
| 2012 | -- | $30,000 +10.3% |
| 2011 | -- | $27,200 -40.2% |
| 2010 | $2,181 | $45,520 |
| 2009 | $2,181 -17.9% | $45,520 -22.4% |
| 2008 | $2,655 +78.9% | $58,680 +9.2% |
| 2007 | $1,484 +2.4% | $53,760 |
| 2006 | $1,449 +9.7% | $53,760 +5.7% |
| 2005 | $1,321 -41.9% | $50,840 |
| 2004 | $2,273 +89.4% | $50,840 +5.4% |
| 2003 | $1,200 +13.4% | $48,240 |
| 2002 | $1,058 +126.5% | $48,240 +323.2% |
| 2001 | $467 | $11,400 |
Find assessor info on the county website
Monthly payment
Est. payment
Payment breakdown
Explore the cost of this home by adjusting the details. Changes won't be saved.Climate risks
Neighborhood: 30087
- $245,5003 bd2 ba1.7k sqft558 Arbor Ridge Dr, Stone Mountain, GA 30087Off Market
- $286,6004 bd2 ba2.8k sqft550 Arbor Ridge Dr, Stone Mountain, GA 30087Off Market

- $272,5004 bd2 ba2.2k sqft546 Arbor Ridge Dr, Stone Mountain, GA 30087Off Market
- $220,2003 bd2 ba1.5k sqft553 Arbor Ridge Dr, Stone Mountain, GA 30087Off Market
Similar homes
- $250,0003 bd3 ba2.1k sqft6833 Wynmeadow Dr, Stone Mountain, GA 30087Active Under Contract
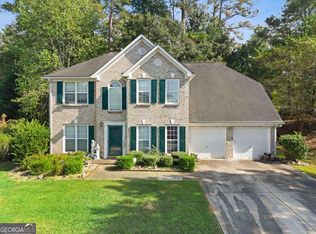
 MLS ID #10852306, Michelle Naicker, Foundation Partners Realty LLC. GAMLS
- $290,0003 bd3 ba1.9k sqft597 Arbor Ridge Dr, Stone Mountain, GA 30087Active
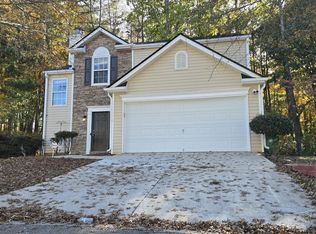 MLS ID #10888053, Quazi A Haque, Atlanta Best Realty LLC. GAMLS
- $--3 bd2 ba1.5k sqft5720 Walter Trl, Stone Mountain, GA 30087Auction
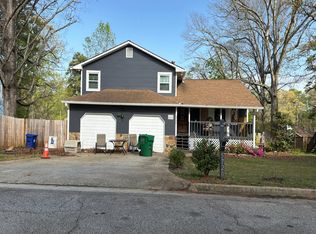 Auction.com 1
- $225,0003 bd3 ba1.4k sqft736 Ashley Ln, Stone Mountain, GA 30087Active
 MLS ID #10878179, Doug Smith, Mainstay Brokerage. GAMLS
- $218,0003 bd3 ba1.5k sqft451 Pennybrook Ln, Stone Mountain, GA 30087ActiveMLS ID #10887174, Susan H Ayers, Clickit Realty Inc.. GAMLS
- $259,9004 bd3 ba2.2k sqft781 Stephenson Rdg, Stone Mountain, GA 30087ActiveMLS ID #10876862, June Hyde, Keller Williams Realty Atl. Partners. GAMLS
- $215,0003 bd2 ba1.4k sqft438 Sherwood Cir, Stone Mountain, GA 30087ActiveMLS ID #10882914, Kino Luke, Genesis Signature Properties. GAMLS
- $227,5003 bd2 ba1.4k sqft429 Sherwood Cir, Stone Mountain, GA 30087ActiveMLS ID #10836387, Stenisha A Reed, Solutions First Realty LLC. GAMLS
- $237,0003 bd2 ba1.3k sqft828 Tradd Ct, Stone Mountain, GA 30087ActiveMLS ID #10783549, Anitra Pope, HomeSmart. GAMLS
- $189,0005 bd2 ba2.3k sqft3016 Nappa Trl, Stone Mountain, GA 30087ActiveMLS ID #10887493, Kris M Kolarich, Southern Classic Realtors. GAMLS
- $249,9003 bd2 ba1.4k sqft5747 McCurdy Ct, Stone Mountain, GA 30087ActiveMLS ID #10830222, Michael Brock, Realty of America. GAMLS
- $224,9004 bd2 ba2.3k sqft5802 Simone Dr, Stone Mountain, GA 30087ActiveMLS ID #10812036, Blake Keathley, EveryState. GAMLS
- $285,0003 bd2 ba1.6k sqft3006 Deshong Dr, Stone Mountain, GA 30087ActiveMLS ID #10878610, Farrah Brown, Atlanta Communities. GAMLS
- $250,0003 bd3 ba1.9k sqft852 Susannah Ct, Lithonia, GA 30058ActiveMLS ID #10888852, Mark Spain, Mark Spain Real Estate. GAMLS
- $229,9004 bd3 ba2.2k sqft6944 Deshon Ridge Dr, Lithonia, GA 30058ActiveMLS ID #10882112, Deetra Wright, City 1st Realty and Financial. GAMLS
- $295,0003 bd2 ba2.6k sqft509 Stonewood Dr, Stone Mountain, GA 30087ActiveMLS ID #10886992, Brittany Purcell & Associates, Keller Williams Greater Athens. GAMLS
- $300,0004 bd3 ba2.4k sqft401 Pineburr Ln, Stone Mountain, GA 30087ActiveMLS ID #10867541, James S Hatcher, James S. Hatcher. GAMLS
- $213,0003 bd2 ba1.3k sqft447 Sherwood Cir, Stone Mountain, GA 30087ActiveMLS ID #10764846, Ted Strane, Evernest LLC. GAMLS
- $290,0003 bd3 ba1.9k sqft3271 Mixon Way, Stone Mountain, GA 30087ActiveMLS ID #10799619, Eric Baham, Sovereign Real Estate Group. GAMLS
