Excellent investment opportunity for those looking to add a value-add multifamily property to their portfolio. The property features spacious three-bedroom, one-bathroom units with functional layouts, generous living areas, and washer/dryer hookups. . The electrical system was updated less than 7 years ago, and the plumbing was updated less than 2 years ago. Ideally suited for cash or rehab financing.
For sale
$399,000
58 Marshall St, Fitchburg, MA 01420
6beds
4,824sqft
2 Family - 2 Units Up/Down
Built in 1910
-- sqft lot
$396,400 Zestimate®
$83/sqft
$-- HOA
What's special
Functional layouts
- 33 days
- 691
- 47
Zillow last checked:
Listing updated:
Listed by:
Jose Tineo 978-866-8567,
Keller Williams Realty North Central 978-840-9000
Source: MLS PIN,MLS#: 73579714
Facts & features
Interior
Bedrooms & bathrooms
- Bedrooms: 6
- Bathrooms: 2
- Full bathrooms: 2
Features
- Living Room, Dining Room, Kitchen
- Basement: Full
- Has fireplace: No
Interior area
- Total structure area: 4,824
- Total interior livable area: 4,824 sqft
- Finished area above ground: 4,824
Property
Features
- Fencing: Fenced/Enclosed
Lot
- Size: 5,580 Square Feet
Details
- Parcel number: 1502313
- Zoning: RC
Construction
Type & style
- Home type: MultiFamily
- Property subtype: 2 Family - 2 Units Up/Down
Materials
- Foundation: Stone
- Roof: Rubber
Condition
- Year built: 1910
Utilities & green energy
- Sewer: Public Sewer
- Water: Public
Community & HOA
Community
- Features: Public Transportation, Park
Location
- Region: Fitchburg
Financial & listing details
- Price per square foot: $83/sqft
- Tax assessed value: $441,700
- Annual tax amount: $5,967
- Date on market: 9/18/2026
- Total actual rent: 3500
Estimated market value
$396,400
$377,000 - $416,000
$1,927/mo
Price history
| Date | Event | Price |
|---|---|---|
| 9/18/2026 | Listed for sale | $399,000-18.6%$83/sqft |
Source: MLS PIN #73579714 Report a problem | ||
| 4/3/2026 | Listing removed | $490,000$102/sqft |
Source: MLS PIN #73472097 Report a problem | ||
| 3/15/2026 | Contingent | $490,000$102/sqft |
Source: MLS PIN #73472097 Report a problem | ||
| 3/4/2026 | Price change | $490,000-3.9%$102/sqft |
Source: MLS PIN #73472097 Report a problem | ||
| 2/11/2026 | Price change | $510,000-7.3%$106/sqft |
Source: MLS PIN #73472097 Report a problem | ||
| 1/28/2026 | Listed for sale | $550,000+10.9%$114/sqft |
Source: MLS PIN #73472097 Report a problem | ||
| 2/21/2024 | Listing removed | -- |
Source: Owner Report a problem | ||
| 2/10/2024 | Price change | $496,000-0.8%$103/sqft |
Source: MLS PIN #73201372 Report a problem | ||
| 2/5/2024 | Listed for sale | $500,000+212.5%$104/sqft |
Source: Owner Report a problem | ||
| 4/29/2020 | Listing removed | $160,000$33/sqft |
Source: KW Pinnacle Central #72646757 Report a problem | ||
| 4/24/2020 | Listed for sale | $160,000$33/sqft |
Source: Keller Williams Realty Greater Worcester #72646757 Report a problem | ||
| 4/24/2020 | Pending sale | $160,000$33/sqft |
Source: Keller Williams Realty Greater Worcester #72646757 Report a problem | ||
| 4/22/2020 | Listed for sale | $160,000+1180%$33/sqft |
Source: Keller Williams Realty Greater Worcester #72646757 Report a problem | ||
| 4/10/2017 | Sold | $12,500+4.2%$3/sqft |
Source: Public Record Report a problem | ||
| 2/2/2016 | Sold | $12,000-88.2%$2/sqft |
Source: Public Record Report a problem | ||
| 7/27/2010 | Sold | $102,000-64.6%$21/sqft |
Source: Public Record Report a problem | ||
| 8/12/2005 | Sold | $288,000$60/sqft |
Source: Public Record Report a problem | ||
Public tax history
| Year | Property taxes | Tax assessment |
|---|---|---|
| 2025 | $5,967 +2% | $441,700 +11.9% |
| 2024 | $5,848 +13.2% | $394,900 +22.4% |
| 2023 | $5,166 +13.8% | $322,500 +25.1% |
| 2022 | $4,540 +3.6% | $257,800 +12% |
| 2021 | $4,381 +6.8% | $230,200 +10.6% |
| 2020 | $4,102 +24.8% | $208,100 +29.7% |
| 2019 | $3,287 +2.4% | $160,400 +5% |
| 2018 | $3,210 -1.4% | $152,800 +0.9% |
| 2017 | $3,254 +2.9% | $151,400 +1.7% |
| 2016 | $3,161 -2.5% | $148,900 -5% |
| 2015 | $3,241 -0.8% | $156,700 -4.9% |
| 2014 | $3,268 -2.6% | $164,800 -6.4% |
| 2013 | $3,355 +17.3% | $176,100 +8.5% |
| 2012 | $2,860 -2% | $162,300 -9.9% |
| 2011 | $2,919 -13.3% | $180,200 -32% |
| 2009 | $3,367 -1.3% | $265,100 -8.6% |
| 2008 | $3,410 +11% | $290,200 +9% |
| 2007 | $3,073 +6.8% | $266,300 +11.7% |
| 2006 | $2,876 +7.4% | $238,500 +14.4% |
| 2005 | $2,678 +30.5% | $208,400 +40.3% |
| 2004 | $2,052 +9.2% | $148,500 +24.5% |
| 2003 | $1,879 +9.2% | $119,300 +23.5% |
| 2001 | $1,721 +5.5% | $96,600 +7.8% |
| 2000 | $1,632 -7.4% | $89,600 -23.3% |
| 1996 | $1,763 | $116,800 |
Find assessor info on the county website
Monthly payment
Est. payment
Payment breakdown
Explore the cost of this home by adjusting the details. Changes won't be saved.Climate risks
Neighborhood: 01420


Similar homes
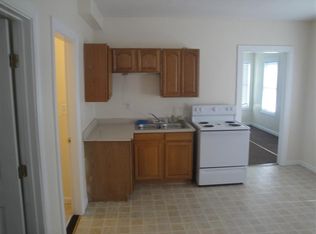
- $--5 bd3 ba3.1k sqft118 Pleasant St, Fitchburg, MA 01420Auction
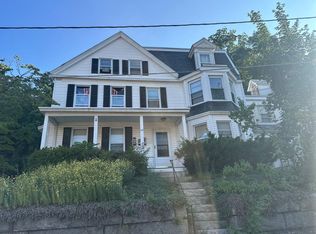 Auction.com 2
- $524,9006 bd3 ba4.9k sqft58 Oliver St, Fitchburg, MA 01420For Sale
 MLS ID #73556860, Kathleen Walsh, Keller Williams Realty North Central. MLS PIN
- $458,0006 bd4 ba3k sqft67-69 Central St, Fitchburg, MA 01420For Sale
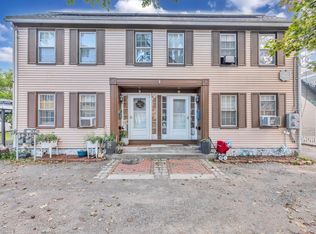 MLS ID #73573339, Christopher Johnson, YPC Real Estate. MLS PIN
- $589,9006 bd3 ba3.1k sqft11 Nutting St, Fitchburg, MA 01420For Sale
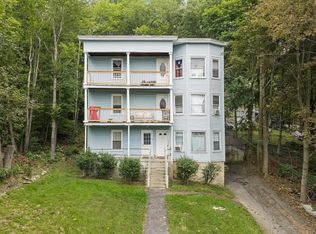 MLS ID #73576281, Nicholas L. Pelletier, Keller Williams Realty North Central. MLS PIN
