This 1642 square foot single family home has 3 bedrooms and 3.0 bathrooms. This home is located at 5999 Camden Cir, Citrus Heights, CA 95621.
Pre-foreclosure
Est. $453,300
5999 Camden Cir, Citrus Heights, CA 95621
3beds
1,642sqft
SingleFamily
Built in 2007
1,611 Square Feet Lot
$453,300 Zestimate®
$276/sqft
$130/mo HOA
Overview
- 110 days
- 17
- 0
Facts & features
Interior
Bedrooms & bathrooms
- Bedrooms: 3
- Bathrooms: 3
- Full bathrooms: 2
- 1/2 bathrooms: 1
Heating
- Other, Gas
Cooling
- Central
Appliances
- Included: Dishwasher, Dryer, Garbage disposal, Microwave, Refrigerator, Washer
- Laundry: In Unit
Features
- Flooring: Tile, Carpet
- Has fireplace: Yes
Interior area
- Total interior livable area: 1,642 sqft
Property
Parking
- Total spaces: 2
- Parking features: Garage - Detached
Features
- Has view: Yes
- View description: Park
Lot
- Size: 1,611 Square Feet
Details
- Parcel number: 22910100130000
Construction
Type & style
- Home type: SingleFamily
Materials
- wood frame
- Roof: Shake / Shingle
Condition
- Year built: 2007
Community & HOA
HOA
- Has HOA: Yes
- HOA fee: $130 monthly
Location
- Region: Citrus Heights
Financial & listing details
- Price per square foot: $276/sqft
- Tax assessed value: $541,214
Foreclosure details
Estimated market value
$453,300
$431,000 - $476,000
$2,499/mo
Price history
| Date | Event | Price |
|---|---|---|
| 1/13/2024 | Listing removed | -- |
Source: Zillow Rentals Report a problem | ||
| 12/9/2023 | Price change | $2,395-2%$1/sqft |
Source: Zillow Rentals Report a problem | ||
| 11/10/2023 | Price change | $2,445-2%$1/sqft |
Source: Zillow Rentals Report a problem | ||
| 10/24/2023 | Price change | $2,495-2%$2/sqft |
Source: Zillow Rentals Report a problem | ||
| 9/23/2023 | Listed for rent | $2,545$2/sqft |
Source: Zillow Rentals Report a problem | ||
| 9/22/2023 | Listing removed | -- |
Source: MetroList Services of CA #223063406 Report a problem | ||
| 7/9/2023 | Listed for sale | $529,000+5.8%$322/sqft |
Source: MetroList Services of CA #223063406 Report a problem | ||
| 3/29/2022 | Sold | $500,000+0.8%$305/sqft |
Source: MetroList Services of CA #222021199 Report a problem | ||
| 3/16/2022 | Pending sale | $495,999$302/sqft |
Source: MetroList Services of CA #222021199 Report a problem | ||
| 3/8/2022 | Listed for sale | $495,999$302/sqft |
Source: MetroList Services of CA #222021199 Report a problem | ||
| 3/3/2022 | Pending sale | $495,999$302/sqft |
Source: MetroList Services of CA #222021199 Report a problem | ||
| 2/25/2022 | Listed for sale | $495,999+87.2%$302/sqft |
Source: MetroList Services of CA #222021199 Report a problem | ||
| 2/8/2008 | Sold | $265,000$161/sqft |
Source: Public Record Report a problem | ||
Public tax history
| Year | Property taxes | Tax assessment |
|---|---|---|
| 2026 | -- | $541,214 +2% |
| 2025 | $6,311 +1% | $530,603 +2% |
| 2024 | $6,251 +2.6% | $520,200 +2% |
| 2023 | $6,092 +1.9% | $510,000 +65.9% |
| 2022 | $5,976 +66.7% | $307,428 +2% |
| 2021 | $3,584 +1.9% | $301,401 +1% |
| 2020 | $3,516 +2.1% | $298,312 +2% |
| 2019 | $3,444 +1.2% | $292,463 +2% |
| 2018 | $3,402 +1% | $286,729 +2% |
| 2017 | $3,367 -2% | $281,108 -4.3% |
| 2016 | $3,435 +10.7% | $293,590 +5.1% |
| 2015 | $3,103 | $279,381 +5% |
| 2014 | $3,103 | $266,077 +25% |
| 2013 | -- | $212,861 +14% |
| 2012 | -- | $186,721 -6% |
| 2011 | -- | $198,640 -8% |
| 2010 | -- | $215,913 +112.2% |
| 2008 | -- | $101,726 +2% |
| 2007 | -- | $99,732 |
Find assessor info on the county website
Monthly payment
Climate risks
Neighborhood: Park Oaks

Similar homes
- $476,0004 bd2 ba1.3k sqft5981 Marlin Cir, Carmichael, CA 95608For Sale
 MLS ID #226135173, Lydia Almanza. MetroList Services of CA
- $455,0003 bd2 ba1.4k sqft7301 Parkvale Way, Citrus Heights, CA 95621For Sale
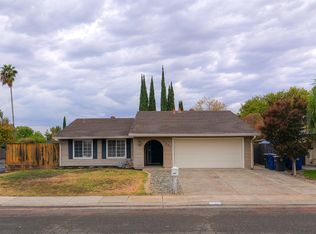 MLS ID #226130704, Carol Kellogg. MetroList Services of CA
- $510,0003 bd2 ba1.6k sqft6444 Oakcreek Way, Citrus Heights, CA 95621For Sale
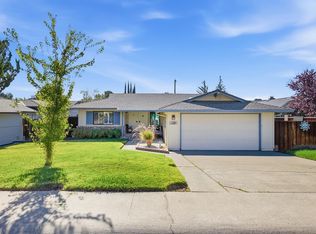 MLS ID #226131846, Debbie Olson. MetroList Services of CA
- $465,0003 bd2 ba1.1k sqft7025 Cherrytree Ave, Citrus Heights, CA 95621For Sale
 MLS ID #226124706, Jaclyn Little. MetroList Services of CA
