This property will be sold through the applicable foreclosure auction process. The property is being sold 'as is' and the occupancy status is assumed to be occupied. The buyer assumes all responsibility for the property condition and occupancy. Sold As Is. Seller does not provide survey. Room sizes are estimated and unverified. Xome Auction. *Property not for rent.*
Pending
$102,120
601 E 32nd St APT 407, Chicago, IL 60616
2beds
1,200sqft
Condominium, Single Family Residence
Built in 1960
-- sqft lot
$-- Zestimate®
$85/sqft
$-- HOA
What's special
- 46 days
- 84
- 1
Zillow last checked:
Listing updated:
Listed by:
Anthony Disano 312-788-4040,
Parkvue Realty Corporation
Source: MRED as distributed by MLS GRID,MLS#: 12762680
Facts & features
Interior
Bedrooms & bathrooms
- Bedrooms: 2
- Bathrooms: 1
- Full bathrooms: 1
Rooms
- Room types: No additional rooms
Primary bedroom
- Level: Main
- Area: 154 Square Feet
- Dimensions: 11X14
Bedroom 2
- Level: Main
- Area: 10 Square Feet
- Dimensions: 10X1
Kitchen
- Level: Main
- Area: 80 Square Feet
- Dimensions: 10X8
Living room
- Level: Main
- Area: 135 Square Feet
- Dimensions: 15X9
Heating
- Baseboard
Cooling
- Central Air
Features
- Basement: None
Interior area
- Total structure area: 0
- Total interior livable area: 1,200 sqft
Property
Parking
- Total spaces: 1
- Parking features: Yes, Attached, Garage
- Attached garage spaces: 1
Accessibility
- Accessibility features: No Disability Access
Lot
- Size: 2.05 Acres
Details
- Parcel number: 17342250031109
- Special conditions: Real Estate Owned
Construction
Type & style
- Home type: Condo
- Property subtype: Condominium, Single Family Residence
Materials
- Aluminum Siding, Brick
Condition
- New construction: No
- Year built: 1960
Utilities & green energy
- Sewer: Public Sewer
- Water: Lake Michigan
Community & HOA
HOA
- Services included: None
Location
- Region: Chicago
Financial & listing details
- Price per square foot: $85/sqft
- Tax assessed value: $129,250
- Annual tax amount: $2,607
- Date on market: 9/17/2026
- Ownership: Fee Simple
Foreclosure details
Estimated market value
Not available
Estimated sales range
Not available
Not available
Price history
| Date | Event | Price |
|---|---|---|
| 7/15/2022 | Sold | $182,000-4.2%$152/sqft |
Source:  MRED as distributed by MLS GRID #11284224 Report a problem | ||
| 7/9/2022 | Contingent | $189,900$158/sqft |
Source: MRED as distributed by MLS GRID #11284224 Report a problem | ||
| 6/9/2022 | Listed for sale | $189,900$158/sqft |
Source: MRED as distributed by MLS GRID #11284224 Report a problem | ||
| 4/22/2022 | Pending sale | $189,900$158/sqft |
Source: MRED as distributed by MLS GRID #11284224 Report a problem | ||
| 4/6/2022 | Contingent | $189,900$158/sqft |
Source: MRED as distributed by MLS GRID #11284224 Report a problem | ||
| 1/27/2022 | Price change | $189,900-2.6%$158/sqft |
Source: MRED as distributed by MLS GRID #11284224 Report a problem | ||
| 12/9/2021 | Listed for sale | $194,900$162/sqft |
Source: MRED as distributed by MLS GRID #11284224 Report a problem | ||
| 12/9/2021 | Listing removed | $194,900$162/sqft |
Source: MRED as distributed by MLS GRID #11269733 Report a problem | ||
| 11/13/2021 | Listed for sale | $194,900+34.4%$162/sqft |
Source: MRED as distributed by MLS GRID #11269733 Report a problem | ||
| 3/8/2019 | Sold | $145,000-33.2%$121/sqft |
Source: MRED as distributed by MLS GRID #10262090 Report a problem | ||
| 4/26/2013 | Listing removed | $1,400$1/sqft |
Source: Dream Town Realty #08302136 Report a problem | ||
| 3/29/2013 | Listed for rent | $1,400$1/sqft |
Source: Dream Town Realty #08302136 Report a problem | ||
| 9/18/2006 | Sold | $217,000+127.2%$181/sqft |
Source: Public Record Report a problem | ||
| 3/6/1998 | Sold | $95,500$80/sqft |
Source: Public Record Report a problem | ||
Public tax history
| Year | Property taxes | Tax assessment |
|---|---|---|
| 2024 | $2,606 +29.6% | $12,925 +36.1% |
| 2023 | $2,011 +2.6% | $9,499 |
| 2022 | $1,960 +2.3% | $9,499 |
| 2021 | $1,916 +11.1% | $9,499 +22.7% |
| 2020 | $1,725 +1.4% | $7,743 -8.6% |
| 2019 | $1,702 +1.7% | $8,471 |
| 2018 | $1,673 +8.2% | $8,471 +17.9% |
| 2017 | $1,546 +7.5% | $7,182 |
| 2016 | $1,439 +9.3% | $7,182 |
| 2015 | $1,316 +4.9% | $7,182 +6.2% |
| 2014 | $1,255 +27.2% | $6,762 +24.7% |
| 2013 | $986 -29.1% | $5,424 -30% |
| 2012 | $1,391 -10.6% | $7,753 -19.3% |
| 2011 | $1,556 -0.4% | $9,603 |
| 2010 | $1,563 -4.8% | $9,603 -8.8% |
| 2009 | $1,642 -3.5% | $10,530 -11.2% |
| 2008 | $1,701 -3.3% | $11,857 -4.2% |
| 2007 | $1,759 -1.1% | $12,382 |
| 2006 | $1,778 -7.3% | $12,382 +5.5% |
| 2005 | $1,918 +1% | $11,740 |
| 2004 | $1,899 +2.2% | $11,740 |
| 2003 | $1,858 +11.1% | $11,740 +26.2% |
| 2002 | $1,672 +3.7% | $9,305 |
| 2001 | $1,611 +14.8% | $9,305 |
| 2000 | $1,403 | $9,305 +0% |
| 1999 | -- | $9,304 |
Find assessor info on the county website
Monthly payment
Climate risks
Neighborhood: Lake Meadows
Nearby schools
- $155,1001 bd-- ba832 sqft601 E 32nd St APT 702, Chicago, IL 60616Off Market
- $121,900-- bd-- ba-- sqft601 E 32nd St APT 1005, Chicago, IL 60616Off Market
- $199,700-- bd-- ba-- sqft601 E 32nd St #PENTHOUSE 3, Chicago, IL 60616Off Market
- $119,3001 bd1 ba-- sqft601 E 32nd St APT 905, Chicago, IL 60616Off Market

Similar homes
- $150,0002 bd2 ba1.1k sqft3021 S Michigan Ave Unit 306, Chicago, IL 60616New
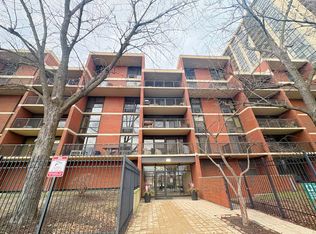 MLS ID #12798990, Cathy Wu, AiHome Realty Group LLC. MRED as distributed by MLS GRID
- $104,900-- bd1 ba650 sqft2901 S Michigan Ave APT 308, Chicago, IL 60616Active
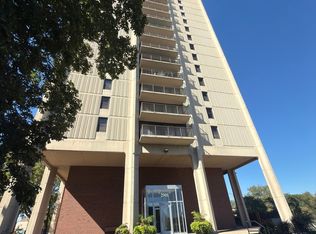 MLS ID #12780609, Jose Andres Torres, Realty of America, LLC. MRED as distributed by MLS GRID
- $101,2003 bd3 ba1.1k sqft4829 S Prairie Ave, Chicago, IL 60615Auction
 Hubzu
- $115,0001 bd1 ba750 sqft3001 S Michigan Ave Unit 1303, Chicago, IL 60616Active
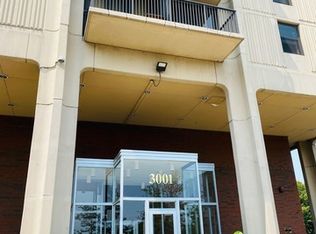 MLS ID #12744091, Mary Kong, Hometown Real Estate Group LLC. MRED as distributed by MLS GRID
