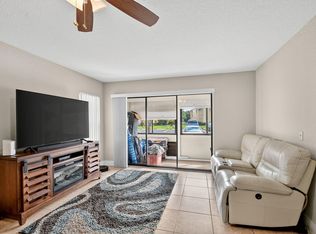
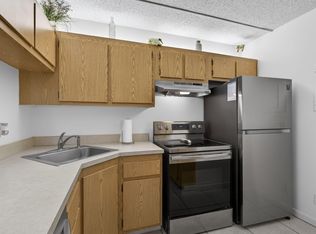
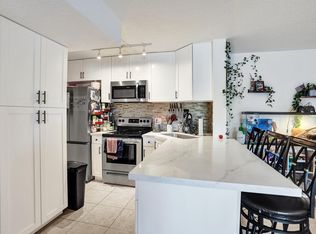
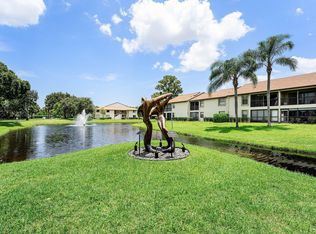
$238,000
2 bd2 ba1k sqft
609 Sea Pine Way APT F2, Greenacres, FL 33415
Sold
Zillow last checked:
Listing updated:
Samuel Gilles 561-723-4300,
Lakesideview Realty Corp
 Originating MLS: BeachesMLS
$193,200
$184,000 - $203,000
$1,999/mo
| Date | Event | Price |
|---|---|---|
| 10/15/2026 | Listed for sale | $199,900$199/sqft |
Source:  BeachesMLS #B26088906 Report a problem | ||
| 9/16/2026 | Listing removed | $199,900$199/sqft |
Source: BeachesMLS #B26046858 Report a problem | ||
| 8/8/2026 | Price change | $199,900-4.4%$199/sqft |
Source: BeachesMLS #B26046858 Report a problem | ||
| 8/3/2026 | Price change | $209,000-8.7%$208/sqft |
Source: BeachesMLS #B26046858 Report a problem | ||
| 7/18/2026 | Price change | $229,000-8%$228/sqft |
Source: BeachesMLS #B26046858 Report a problem | ||
| 6/30/2026 | Listed for sale | $249,000+3.8%$248/sqft |
Source: BeachesMLS #B26046858 Report a problem | ||
| 6/12/2024 | Listing removed | $239,900$239/sqft |
Source: BeachesMLS #RX-10990848 Report a problem | ||
| 5/27/2024 | Listed for sale | $239,900-4%$239/sqft |
Source: BeachesMLS #RX-10990848 Report a problem | ||
| 3/2/2024 | Listing removed | -- |
Source: BeachesMLS #RX-10939733 Report a problem | ||
| 12/1/2023 | Listed for sale | $249,999+47.1%$249/sqft |
Source: BeachesMLS #RX-10939733 Report a problem | ||
| 6/11/2021 | Listing removed | -- |
Source: BeachesMLS #RX-10677262 Report a problem | ||
| 12/31/2020 | Price change | $170,000-5.6%$169/sqft |
Source: BeachesMLS #RX-10677262 Report a problem | ||
| 12/10/2020 | Listed for sale | $180,000+33.3%$179/sqft |
Source: Selected Homes Realty LLC #RX-10677262 Report a problem | ||
| 7/17/2020 | Sold | $135,000-6.9%$134/sqft |
Source: BeachesMLS #R10613403 Report a problem | ||
| 5/22/2020 | Price change | $144,990-3.3%$144/sqft |
Source: Partnership Realty Inc. #RX-10613403 Report a problem | ||
| 3/31/2020 | Listed for sale | $149,999$149/sqft |
Source: Partnership Realty Inc. #RX-10613403 Report a problem | ||
| Year | Property taxes | Tax assessment |
|---|---|---|
| 2025 | $4,309 +3% | $210,263 +3.2% |
| 2024 | $4,183 +8.8% | $203,759 +10% |
| 2023 | $3,843 +101.7% | $185,235 +48.3% |
| 2022 | $1,905 +1.4% | $124,872 +3% |
| 2021 | $1,879 -11.7% | $121,235 +53.4% |
| 2020 | $2,128 +6.9% | $79,013 +10% |
| 2019 | $1,990 | $71,830 -22.4% |
| 2018 | $1,990 +16.2% | $92,546 +5.7% |
| 2017 | $1,712 +11.8% | $87,546 +62.2% |
| 2016 | $1,532 +8.8% | $53,967 +10% |
| 2015 | $1,408 +25.3% | $49,061 +10% |
| 2014 | $1,124 +13.9% | $44,601 +10% |
| 2013 | $987 +4.1% | $40,546 +6.7% |
| 2012 | $948 -18.3% | $38,000 -19.1% |
| 2011 | $1,160 -2.2% | $47,000 -2.1% |
| 2010 | $1,186 -7.8% | $48,000 -14.3% |
| 2009 | $1,286 -33.5% | $56,000 -42% |
| 2008 | $1,933 -21.1% | $96,600 -23.1% |
| 2007 | $2,451 -5.5% | $125,580 +5% |
| 2006 | $2,593 | $119,600 +30% |
| 2005 | -- | $92,000 +22.7% |
| 2004 | $944 +996.7% | $75,000 +14.9% |
| 2003 | $86 -93.1% | $65,300 +26.1% |
| 2002 | $1,245 +3.3% | $51,765 +5% |
| 2001 | $1,205 +20.1% | $49,300 +22.3% |
| 2000 | $1,003 +9.5% | $40,300 |
| 1999 | $916 | $40,300 |
Source: BeachesMLS. This data may not be complete. We recommend contacting the local school district to confirm school assignments for this home.

A local agent can set up tours, give advice and negotiate with sellers.