Perfect family home, situated on 2 country acres! Offering more than 2100 sq ft of living space, 3 bedrooms, 2 baths, formal dining room, living room, family room, den, and eat-in kitchen with breakfast bar. Dining room opens to composite deck overlooking fenced backyard with separately fenced raised garden area. 2 additional storage buildings and carport are perfect for tools and toys. Land is also equipped with 50 amp breaker for RV hook up. Buckeye Valley School District.
For sale
$447,700
6105 Houseman Rd, Ostrander, OH 43061
3beds
2,184sqft
Single Family Residence
Built in 1983
2 Acres Lot
$442,600 Zestimate®
$205/sqft
$-- HOA
What's special
Fenced backyardFamily roomFormal dining room
- 6 days
- 182
- 11
Likely to sell faster than
Zillow last checked:
Listing updated:
Listed by:
Carol Lessick,
Century 21 Excellence Realty
Source: KCBR,MLS#: 20260671
Facts & features
Interior
Bedrooms & bathrooms
- Bedrooms: 3
- Bathrooms: 2
- Full bathrooms: 2
Features
- Has fireplace: No
Interior area
- Total structure area: 2,184
- Total interior livable area: 2,184 sqft
- Finished area above ground: 2,184
Property
Parking
- Parking features: No Garage
Features
- Levels: Split Level
Lot
- Size: 2 Acres
- Dimensions: 2
Details
- Parcel number: 20040005023000
Construction
Type & style
- Home type: SingleFamily
- Property subtype: Single Family Residence
Condition
- Year built: 1983
Community & HOA
Community
- Subdivision: None
Location
- Region: Ostrander
Financial & listing details
- Price per square foot: $205/sqft
- Tax assessed value: $258,300
- Annual tax amount: $3,010
- Date on market: 10/27/2026
Estimated market value
$442,600
$420,000 - $465,000
$2,416/mo
Price history
| Date | Event | Price |
|---|---|---|
| 10/27/2026 | Listed for sale | $447,700-0.5%$205/sqft |
Source:  Columbus and Central Ohio Regional MLS #226040376 Report a problem | ||
| 10/7/2026 | Listing removed | $449,900$206/sqft |
Source: Columbus and Central Ohio Regional MLS #226014685 Report a problem | ||
| 7/31/2026 | Price change | $449,900-2.2%$206/sqft |
Source: Columbus and Central Ohio Regional MLS #226014685 Report a problem | ||
| 7/13/2026 | Price change | $459,900-2.1%$211/sqft |
Source: Columbus and Central Ohio Regional MLS #226014685 Report a problem | ||
| 6/23/2026 | Price change | $469,900-2.1%$215/sqft |
Source: Columbus and Central Ohio Regional MLS #226014685 Report a problem | ||
| 6/11/2026 | Price change | $479,900-1.1%$220/sqft |
Source: Columbus and Central Ohio Regional MLS #226014685 Report a problem | ||
| 5/1/2026 | Listed for sale | $485,000+162.2%$222/sqft |
Source: Columbus and Central Ohio Regional MLS #226014685 Report a problem | ||
| 5/15/2015 | Sold | $185,000-2.6%$85/sqft |
Source: Columbus and Central Ohio Regional MLS #214037389 Report a problem | ||
| 4/14/2015 | Pending sale | $189,900$87/sqft |
Source: RE/MAX Affiliates #214037389 Report a problem | ||
| 2/27/2015 | Price change | $189,900-0.1%$87/sqft |
Source: RE/MAX Affiliates #214037389 Report a problem | ||
| 10/9/2014 | Price change | $190,000-9.5%$87/sqft |
Source: RE/MAX Affiliates #214037389 Report a problem | ||
| 8/27/2014 | Listed for sale | $209,900+1579.2%$96/sqft |
Source: RE/MAX Affiliates #214037389 Report a problem | ||
| 4/1/1983 | Sold | $12,500$6/sqft |
Source: Agent Provided Report a problem | ||
Public tax history
| Year | Property taxes | Tax assessment |
|---|---|---|
| 2025 | $3,041 +1.9% | $90,410 |
| 2024 | $2,986 +0% | $90,410 |
| 2023 | $2,985 +26.7% | $90,410 +42.3% |
| 2022 | $2,355 +2.8% | $63,530 |
| 2021 | $2,291 -0.6% | $63,530 |
| 2020 | $2,304 +5.5% | $63,530 +15.7% |
| 2019 | $2,184 -1.8% | $54,920 |
| 2018 | $2,224 +10.2% | $54,920 +3.5% |
| 2017 | $2,019 | $53,060 |
| 2016 | $2,019 -5.3% | $53,060 |
| 2015 | $2,132 +6.5% | $53,060 |
| 2014 | $2,002 +0.2% | $53,060 +4.3% |
| 2013 | $1,999 +2.4% | $50,860 |
| 2012 | $1,952 +0.5% | $50,860 |
| 2011 | $1,943 -6.4% | $50,860 -7.4% |
| 2010 | $2,077 -0.4% | $54,950 |
| 2009 | $2,086 +4.7% | $54,950 |
| 2008 | $1,992 +6.7% | $54,950 |
| 2007 | $1,868 +0.1% | $54,950 |
| 2006 | $1,866 +4.4% | $54,950 |
| 2005 | $1,788 | $54,950 |
| 2004 | -- | -- |
| 2003 | $2,380 | $49,175 |
| 2002 | -- | $49,175 +11.2% |
| 2000 | $2,286 -1.8% | $44,240 |
| 1999 | $2,328 | $44,240 |
Find assessor info on the county website
Monthly payment
Est. payment
Payment breakdown
Explore the cost of this home by adjusting the details. Changes won't be saved.Climate risks
Neighborhood: 43061


Similar homes
- $484,9003 bd3 ba2k sqft1251 Carr Rd, Ostrander, OH 43061For Sale
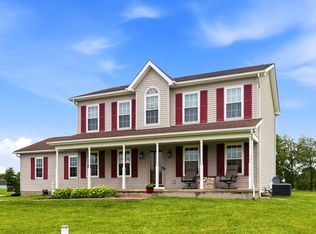
 MLS ID #226030516, Ryan D Reynolds, Keller Williams Consultants. Columbus and Central Ohio Regional MLS
- $440,0004 bd3 ba2.4k sqft1026 Wolfinger Rd, Marion, OH 43302For Sale
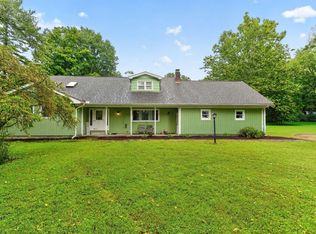 MLS ID #226041427, Jessica Doss, Coldwell Banker Realty. Columbus and Central Ohio Regional MLS
- $314,9003 bd2 ba1.4k sqft1019 Ostrander Rd, Ostrander, OH 43061For Sale
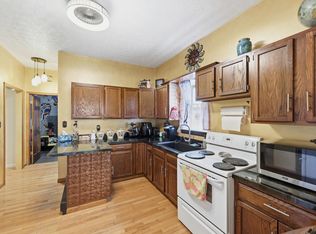 MLS ID #226027001, Kimberly J Slane, Red 1 Realty. Columbus and Central Ohio Regional MLS
- $439,0004 bd3 ba2.5k sqft112 Millcroft Pl, Delaware, OH 43015For Sale
 MLS ID #226039035, Erich V Alexander, NextHome Experience. Columbus and Central Ohio Regional MLS
- $440,0004 bd2 ba2.1k sqft3916 Piatt Rd, Delaware, OH 43015For SaleMLS ID #226038218, Scott R Noblet, EXP Realty, LLC. Columbus and Central Ohio Regional MLS
- $449,9004 bd2 ba1.8k sqft19389 Bellville Rd, Marysville, OH 43040For SaleMLS ID #226039588, Gregery T Watson, Red 1 Realty. Columbus and Central Ohio Regional MLS
- $469,9004 bd3 ba2k sqft7767 Schoolway Ct, Dublin, OH 43016For SaleMLS ID #226041140, Tracy Chambers, Keller Williams Consultants. Columbus and Central Ohio Regional MLS
- $399,9003 bd3 ba2.1k sqft204 Knight Dream St, Delaware, OH 43015For SaleMLS ID #226038057, Cristine R Riedmiller, Howard Hanna Real Estate Services. Columbus and Central Ohio Regional MLS
- $450,0005 bd2 ba2.3k sqft1858 County Road 159, Ashley, OH 43003For SaleMLS ID #226039384, Nicholas Chalton, Red 1 Realty. Columbus and Central Ohio Regional MLS
- $500,0004 bd3 ba1.9k sqft2873 Clark Shaw Rd, Powell, OH 43065For SaleMLS ID #226034286, Andrea R Kaper, Keller Williams Consultants. Columbus and Central Ohio Regional MLS
- $409,9005 bd3 ba2.3k sqft13983 Oxford Dr, Marysville, OH 43040For SaleMLS ID #226039071, Lory Kim, RE/MAX Connection. Columbus and Central Ohio Regional MLS
- $444,0004 bd1 ba1.9k sqft14373 Weaver Rd, Marysville, OH 43040For SaleMLS ID #226032660, Charles Scheiderer, Roby Realty. Columbus and Central Ohio Regional MLS
- $499,0003 bd2 ba2.3k sqft7745 State Route 257 N, Prospect, OH 43342For SaleMLS ID #226017320, Ryan J Ruehle, EXP Realty, LLC. Columbus and Central Ohio Regional MLS
- $485,0004 bd3 ba1.9k sqft5231 Avery Rd, Dublin, OH 43016For SaleMLS ID #226035330, Bre Barnauskas, Coldwell Banker Realty. Columbus and Central Ohio Regional MLS
- $429,0004 bd3 ba2.4k sqft22 Tabilore Loop, Delaware, OH 43015For SaleMLS ID #226019269, James E Wimmers, Keller Williams Consultants. Columbus and Central Ohio Regional MLS
- $575,0004 bd3 ba2.1k sqft2248 Troy Rd, Delaware, OH 43015For SaleMLS ID #226032304, Shannon M Brewster, Cutler Real Estate. Columbus and Central Ohio Regional MLS
- $475,0004 bd3 ba2.1k sqft3909 Driscoll Ct, Dublin, OH 43016For SaleMLS ID #226040098, Jay S Walther, Coldwell Banker Realty. Columbus and Central Ohio Regional MLS
- $469,9003 bd4 ba2.7k sqft5146 Drumcliff Ct, Columbus, OH 43221For SaleMLS ID #226038117, Katherine Davis Spence, The Brokerage House . Columbus and Central Ohio Regional MLS
- $459,0004 bd3 ba2.4k sqft3168 Royal Dornoch Cir, Delaware, OH 43015For SaleMLS ID #226029743, Ryan J Ruehle, EXP Realty, LLC. Columbus and Central Ohio Regional MLS
- $350,0003 bd1 ba2.1k sqft1410 Stratford Rd, Delaware, OH 43015For SaleMLS ID #225011189, Douglas J Ryan, KW Classic Properties Realty. Columbus and Central Ohio Regional MLS
