This 2300 square foot single family home has 4 bedrooms and 3.0 bathrooms. This home is located at 6340 Tri Ln, El Sobrante, CA 94803.
Pre-foreclosure
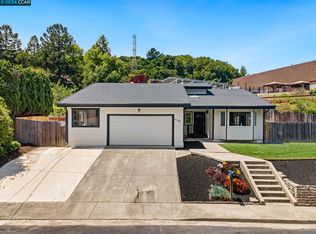
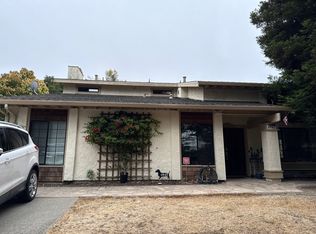
Street View
Est. $1,292,600
6340 Tri Ln, El Sobrante, CA 94803
4beds
2,300sqft
SingleFamily
Built in 1979
9,975 Square Feet Lot
$1,292,600 Zestimate®
$562/sqft
$-- HOA
Overview
- 80 days |
- 109 |
- 6 |
Facts & features
Interior
Bedrooms & bathrooms
- Bedrooms: 4
- Bathrooms: 3
- Full bathrooms: 2
- 1/2 bathrooms: 1
Heating
- Forced air
Appliances
- Included: Dishwasher, Dryer, Freezer, Garbage disposal, Microwave, Range / Oven, Refrigerator, Washer
Features
- Flooring: Laminate
- Basement: None
- Has fireplace: Yes
Interior area
- Total interior livable area: 2,300 sqft
Property
Parking
- Total spaces: 2
- Parking features: Garage - Attached, Off-street, On-street
Features
- Exterior features: Other, Wood
Lot
- Size: 9,975 Square Feet
Details
- Parcel number: 4351720075
Construction
Type & style
- Home type: SingleFamily
Materials
- wood frame
- Roof: Tile
Condition
- Year built: 1979
Community & HOA
Location
- Region: El Sobrante
Financial & listing details
- Price per square foot: $562/sqft
- Tax assessed value: $422,612
- Annual tax amount: $6,605
Visit our professional directory to find a foreclosure specialist in your area that can help with your home search.
Find a foreclosure agentForeclosure details
Estimated market value
$1,292,600
$1.16M - $1.45M
$4,368/mo
Price history
| Date | Event | Price |
|---|---|---|
| 4/15/1992 | Sold | $48,500$21/sqft |
Source: Agent Provided Report a problem | ||
Public tax history
| Year | Property taxes | Tax assessment |
|---|---|---|
| 2025 | $6,605 +2.3% | $422,612 +2% |
| 2024 | $6,454 +2.2% | $414,326 +2% |
| 2023 | $6,312 +1.5% | $406,203 +2% |
| 2022 | $6,220 +0.5% | $398,239 +2% |
| 2021 | $6,186 +4.4% | $390,431 +1% |
| 2020 | $5,927 +1.4% | $386,429 +2% |
| 2019 | $5,844 +4% | $378,853 +2% |
| 2018 | $5,617 +2.6% | $371,425 +2% |
| 2017 | $5,477 +1.4% | $364,143 +2% |
| 2016 | $5,401 +1.5% | $357,004 +1.5% |
| 2015 | $5,322 | $351,642 +2% |
| 2014 | $5,322 | $344,755 +0.5% |
| 2013 | -- | $343,198 +2% |
| 2012 | -- | $336,469 +2% |
| 2011 | -- | $329,872 +0.8% |
| 2010 | -- | $327,407 -0.2% |
| 2009 | -- | $328,185 +2% |
| 2008 | -- | $321,751 +2% |
| 2007 | -- | $315,443 +2% |
| 2006 | -- | $309,258 +2% |
| 2005 | -- | $303,195 +2% |
| 2004 | -- | $297,251 +1.9% |
| 2003 | -- | $291,804 +2% |
| 2002 | -- | $286,083 +2% |
| 2001 | -- | $280,474 |
Find assessor info on the county website
Monthly payment
Estimated monthly payment$1,822
All calculations are estimates and provided by Zillow, Inc. for informational purposes only. Actual amounts may vary.
HOA fees may include property taxes on listings classified as Co-Ops. Contact the listing agent and/or owner for fee details.
Mortgage interest rates are dependent on a number of factors, including credit score, down payment, and repayment length. Interest rate data provided by Zillow Group Marketplace, Inc. as of 1/1/1970 from various mortgage lenders with which we have lead or other similar arrangements; the Estimated Payment is an average of those rates.
See how much you could borrow to make a competitive offer.
Climate risks
Neighborhood: 94803
Nearby schools
GreatSchools rating
- 7/10Olinda Elementary SchoolGrades: K-6Distance: 0.7 mi
- 2/10Betty Reid Soskin MiddleGrades: 6-8Distance: 3.3 mi
- 4/10De Anza Senior High SchoolGrades: 9-12Distance: 1.7 mi


Nearby cities
Nearby zip codes
Other El Sobrante Topics
