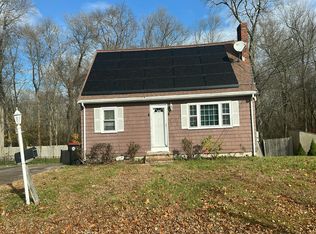
Calling all contractors, builders, and visionaries looking for their next project! Value-add opportunity; being Sold AS-IS — By Appointment Only. Corner-lot convenience meets outdoor charm. Boasting the rare advantage of dual driveway access — including front walkout basement and side-street access for enhanced utility. This property preserves a distinct neighborhood vibe, all while keeping you effortlessly close to regional transit, local shopping and daily amenities — with the added bonus of having Harding’s Pond Conservation Area within easy walking distance for outdoor escapes. Please respect the owners' privacy — strictly no trespassing or unauthorized site visits — Property must be viewed by appointment only and accompanied by owner. All drive-by viewings are restricted to the roadside; do not enter the lot or driveway.
For sale by owner
$450,000
645 Temple St, Whitman, MA 02382
3beds
1,684sqft
SingleFamily
Built in 1953
0.25 Acres Lot
$-- Zestimate®
$267/sqft
$-- HOA
What's special
Dual driveway accessCorner-lot convenienceFront walkout basementOutdoor charm
- 20 days
- 611
- 14
Listed by:
Property Owner (508) 468-1345
Facts & features
Interior
Bedrooms & bathrooms
- Bedrooms: 3
- Bathrooms: 1
- Full bathrooms: 1
Heating
- Other, Electric
Cooling
- Central
Appliances
- Included: Dishwasher, Dryer, Range / Oven, Refrigerator, Washer
Features
- Flooring: Hardwood, Laminate
- Basement: Partially finished
- Has fireplace: Yes
Interior area
- Total interior livable area: 1,684 sqft
Property
Parking
- Total spaces: 4
- Parking features: Off-street
Features
- Exterior features: Wood, Brick
- View description: None
Lot
- Size: 0.25 Acres
Details
- Parcel number: WHITM020AB0117L48
Construction
Type & style
- Home type: SingleFamily
Materials
- Frame
- Roof: Asphalt
Condition
- New construction: No
- Year built: 1953
Community & HOA
Location
- Region: Whitman
Financial & listing details
- Price per square foot: $267/sqft
- Tax assessed value: $414,500
- Annual tax amount: $5,438
- Date on market: 10/30/2026
Estimated market value
Not available
Estimated sales range
Not available
$2,919/mo
Price history
| Date | Event | Price |
|---|---|---|
| 10/30/2026 | Listed for sale | $450,000$267/sqft |
Source: Owner Report a problem | ||
Public tax history
| Year | Property taxes | Tax assessment |
|---|---|---|
| 2025 | $5,438 +5.9% | $414,500 +2.9% |
| 2024 | $5,133 +1% | $402,900 +7.6% |
| 2023 | $5,083 +2.6% | $374,600 +10.1% |
| 2022 | $4,953 +7.2% | $340,200 +14.1% |
| 2021 | $4,622 +1.1% | $298,200 +3.4% |
| 2020 | $4,570 +7.2% | $288,300 +4% |
| 2019 | $4,262 +2.8% | $277,100 +7% |
| 2018 | $4,145 +6.2% | $258,900 |
| 2017 | $3,904 +8.3% | $258,900 +12% |
| 2016 | $3,604 -0.1% | $231,200 |
| 2015 | $3,609 -1.3% | $231,200 |
| 2014 | $3,655 -2.2% | $231,200 -2.3% |
| 2013 | $3,737 +2.1% | $236,700 -5.4% |
| 2012 | $3,659 +4.2% | $250,300 -4.2% |
| 2011 | $3,511 +5.1% | $261,400 -3% |
| 2010 | $3,342 +4% | $269,500 -4.6% |
| 2009 | $3,214 -2% | $282,400 -6.1% |
| 2008 | $3,279 +7.8% | $300,800 +6.2% |
| 2007 | $3,043 +1.7% | $283,300 +7.3% |
| 2006 | $2,991 +6.8% | $264,000 +10% |
| 2005 | $2,801 -7.9% | $240,000 +36.5% |
| 2004 | $3,041 +3% | $175,800 +9% |
| 2003 | $2,953 +19.1% | $161,300 +34% |
| 2001 | $2,480 +1.5% | $120,400 |
| 2000 | $2,444 | $120,400 |
Find assessor info on the county website
Monthly payment
Est. payment
Payment breakdown
Explore the cost of this home by adjusting the details. Changes won't be saved.Climate risks
Neighborhood: 02382
Similar homes
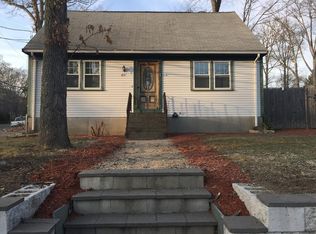
- $439,9004 bd2 ba1.4k sqft715 Washington St, Whitman, MA 02382For Sale
 MLS ID #73600461, Judy Walsh, Keller Williams Realty Signature Properties. MLS PIN
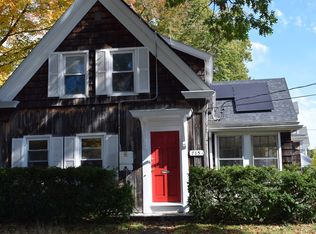
- $599,0003 bd2 ba1.5k sqft53 Newland Dr, Whitman, MA 02382For Sale
 MLS ID #73603830, Hillary Birch, Compass. MLS PIN
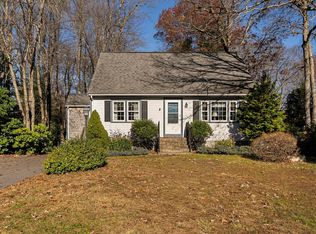
- $449,9003 bd1 ba1.9k sqft62 Anawan St, Brockton, MA 02302For Sale
 MLS ID #73602729, Eileen Cain, William Raveis R.E. & Home Services. MLS PIN
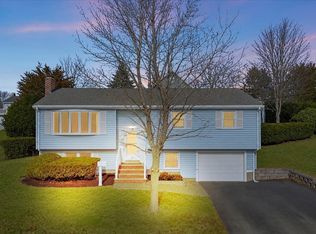
- $--3 bd3 ba1.9k sqft780 Summer St, Brockton, MA 02302Auction
 Auction.com 2
