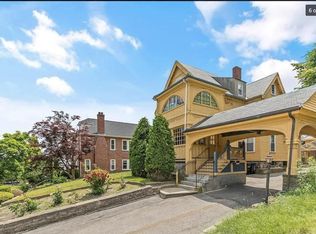
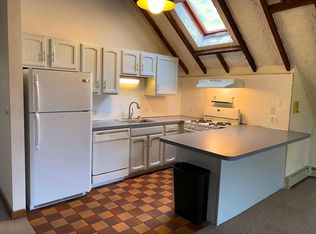
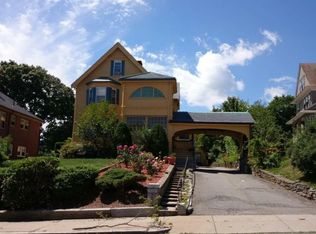
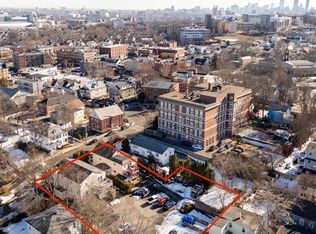
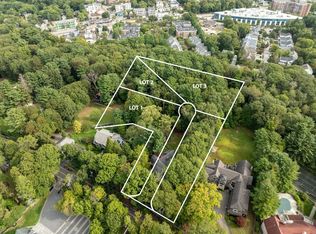
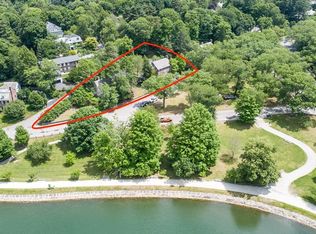
Bring your vision to Oak Sq. Brighton near Newton Corner! Gorgeous property with excellent value-add potential. 3 parcels, 1 property. Approx 0.73 acres. Currently 5 rental units. Main house has 2 units, 5-6BR/2BA on 2 floors, and a 2BR/1BA. The Carriage house building currently has 3 rental units: Two 1BR/1BA and One 3BR/1BA. All TAW. Gross income $165,000 per year. (See attachment). The Carriage House work space itself has a common laundry room for the 3 units, and an open air, wood-beamed, granite-flanked space that is your blank canvas for design ideas. 9 ft ceilings. The possibilities are endless. The 3rd development idea is waiting next door on the 3rd parcel of approx 0.35 acres. Reach out to list agent with your questions and schedule a tour. Happy to show and brainstorm options.
Lot/land
$3,995,000
664 Washington St, Boston, MA 02135
--beds
0baths
0.73Acres
Residential
Built in ----
0.73 Acres Lot
$-- Zestimate®
$--/sqft
$-- HOA
What's special
- 18 days |
- 218 |
- 3 |
Zillow last checked:
Listing updated:
Listed by:
Ted Fairchild 808-895-6563,
Stuart St James, Inc. 617-819-5850
Source: MLS PIN,MLS#: 73534708
Facts & features
Interior
Bedrooms & bathrooms
- Bathrooms: 0
Features
- Has basement: No
Property
Lot
- Size: 0.73 Acres
- Features: Cleared
Details
- Parcel number: 1220324
- Zoning: 2F-5000
Utilities & green energy
- Electric: On-Site
- Gas: On-Site
- Sewer: Public Sewer
- Water: Public
Community & HOA
Community
- Features: Public Transportation, Shopping, Park, Walk/Jog Trails, Medical Facility, Highway Access, Private School, T-Station
HOA
- Has HOA: No
Location
- Region: Boston
Financial & listing details
- Tax assessed value: $2,040,300
- Annual tax amount: $23,627
- Date on market: 6/11/2026
- Electric utility on property: Yes
Estimated market value
Not available
Estimated sales range
Not available
$2,854/mo
Price history
| Date | Event | Price |
|---|---|---|
| 6/11/2026 | Listed for sale | $3,995,000+1.7% |
Source: MLS PIN #73534563 Report a problem | ||
| 10/20/2025 | Listing removed | $3,930,000 |
Source: MLS PIN #73393873 Report a problem | ||
| 6/19/2025 | Listed for sale | $3,930,000-27.9% |
Source: MLS PIN #73393873 Report a problem | ||
| 5/26/2024 | Listing removed | $5,450,000 |
Source: MLS PIN #73190187 Report a problem | ||
| 10/11/2023 | Listed for sale | $5,450,000+544999900% |
Source: MLS PIN #73169022 Report a problem | ||
| 11/1/2022 | Listing removed | $1 |
Source: MLS PIN #73007381 Report a problem | ||
| 10/6/2022 | Price change | $1-100% |
Source: MLS PIN #73007381 Report a problem | ||
| 7/6/2022 | Listed for sale | $6,750,000 |
Source: MLS PIN #73007381 Report a problem | ||
| 2/15/2019 | Listing removed | $3,437 |
Source: Zillow Rental Manager Report a problem | ||
| 1/22/2019 | Price change | $3,437+2.3% |
Source: Zillow Rental Manager Report a problem | ||
| 1/17/2019 | Listed for rent | $3,360-23.5% |
Source: Zillow Rental Manager Report a problem | ||
| 1/28/2017 | Listing removed | $4,395+7.2% |
Source: Zillow Rental Manager Report a problem | ||
| 12/26/2014 | Listing removed | $4,100 |
Source: Zillow Rental Network Report a problem | ||
| 10/23/2014 | Listed for rent | $4,100 |
Source: Zillow Rental Network Report a problem | ||
Public tax history
| Year | Property taxes | Tax assessment |
|---|---|---|
| 2025 | $23,627 +9.6% | $2,040,300 +3.1% |
| 2024 | $21,563 +9.6% | $1,978,300 +8% |
| 2023 | $19,674 +2.9% | $1,831,800 +4.3% |
| 2022 | $19,116 +2.7% | $1,757,000 +0.7% |
| 2021 | $18,608 +5.7% | $1,744,000 +4.6% |
| 2020 | $17,601 +4.6% | $1,666,792 +4.4% |
| 2019 | $16,821 +6.9% | $1,595,948 +6.3% |
| 2018 | $15,733 +389.1% | $1,501,252 +1.3% |
| 2017 | $3,217 -78.3% | $1,482,473 +10% |
| 2016 | $14,828 +5.7% | $1,347,994 +16.4% |
| 2015 | $14,025 +7.5% | $1,158,174 +16.6% |
| 2013 | $13,048 +1% | $993,016 +0.2% |
| 2012 | $12,917 +1.9% | $990,600 |
| 2011 | $12,670 +25.4% | $990,600 +16.5% |
| 2010 | $10,104 +7.8% | $850,510 -3.5% |
| 2009 | $9,371 -10.5% | $881,520 -7.6% |
| 2008 | $10,468 -1.9% | $954,240 -1.7% |
| 2007 | $10,669 | $970,800 |
Find assessor info on the county website
Monthly payment
Estimated monthly payment$1,822
All calculations are estimates and provided by Zillow, Inc. for informational purposes only. Actual amounts may vary.
HOA fees may include property taxes on listings classified as Co-Ops. Contact the listing agent and/or owner for fee details.
Mortgage interest rates are dependent on a number of factors, including credit score, down payment, and repayment length. Interest rate data provided by Zillow Group Marketplace, Inc. as of 1/1/1970 from various mortgage lenders with which we have lead or other similar arrangements; the Estimated Payment is an average of those rates.
See how much you could borrow to make a competitive offer.
Climate risks
Neighborhood: Brighton
Nearby schools
GreatSchools rating
- 2/10Mary Lyon K-8 SchoolGrades: K-8Distance: 0.5 mi
- 4/10Lyon High SchoolGrades: 9-12Distance: 0.5 mi
- 4/10Edison K-8Grades: PK-6Distance: 0.7 mi

A local agent can set up tours, give advice and negotiate with sellers.

- Massachusetts
- Suffolk County
- Boston
- 02135
- Brighton
- 664 Washington St
Nearby cities
Nearby neighborhoods
Nearby zip codes
Other Boston Topics
