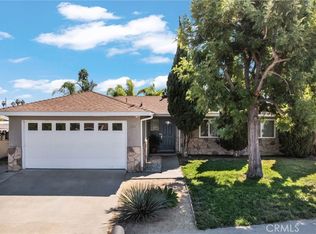
Currently, this property is for under contract and for entry purposes only. This is an Investor Special with a major opportunity for a great return on investment. This home most likely will be a Complete Gut, potentially down to the studs. Please take a look at the comps and you will see there is a potential for a fantastic return on investment. Agents please look at Agent remarks section.
Pending
$554,900
668 Arthur Ave, Oceanside, CA 92057
4beds
1,276sqft
Other
Built in 1972
6,398 Square Feet Lot
$525,000 Zestimate®
$435/sqft
$-- HOA
What's special
- 10 days
- 56
- 0
Zillow last checked:
Listed by:
Grace Hudson-Plummer,
EXIT ALLIANCE REALTY
Source: EXIT Realty broker feed,MLS#: SW26212791
Facts & features
Interior
Bedrooms & bathrooms
- Bedrooms: 4
- Bathrooms: 2
- Full bathrooms: 2
Cooling
- None
Features
- Basement:
- Has fireplace: No
Interior area
- Total structure area: 1,276
- Total interior livable area: 1,276 sqft
Video & virtual tour
Property
Lot
- Size: 6,398 Square Feet
Details
- Parcel number: 1222303600
Construction
Type & style
- Home type: SingleFamily
- Property subtype: Other
Condition
- Year built: 1972
Community & HOA
Location
- Region: Oceanside
Financial & listing details
- Price per square foot: $435/sqft
- Tax assessed value: $174,685
- Date on market: 10/8/2026
- Lease term: Contact For Details
Estimated market value
$525,000
$488,000 - $567,000
$4,223/mo
Price history
| Date | Event | Price |
|---|---|---|
| 10/13/2026 | Sold | $525,000-5.4%$411/sqft |
Source:  CRMLS #SW26212791 Report a problem | ||
| 10/8/2026 | Pending sale | $554,900$435/sqft |
Source: CRMLS #SW26212791 Report a problem | ||
| 9/30/2026 | Contingent | $554,900$435/sqft |
Source: CRMLS #SW26212791 Report a problem | ||
Public tax history
| Year | Property taxes | Tax assessment |
|---|---|---|
| 2026 | -- | $174,685 +2% |
| 2025 | $1,966 +2% | $171,261 +2% |
| 2024 | $1,928 +3.2% | $167,904 +2% |
| 2023 | $1,869 +1.5% | $164,613 +2% |
| 2022 | $1,841 -0.4% | $161,387 +2% |
| 2021 | $1,848 +3.1% | $158,224 +1% |
| 2020 | $1,792 +5.9% | $156,603 +2% |
| 2019 | $1,692 -1.8% | $153,534 +2% |
| 2018 | $1,723 +1.9% | $150,524 +2% |
| 2017 | $1,691 +3.4% | $147,574 +2% |
| 2016 | $1,636 +2.9% | $144,682 +1.5% |
| 2015 | $1,589 +3.9% | $142,510 +2% |
| 2014 | $1,530 | $139,720 +0.5% |
| 2013 | -- | $139,090 +2% |
| 2012 | -- | $136,363 +2% |
| 2011 | -- | $133,690 +0.8% |
| 2010 | -- | $132,692 -0.2% |
| 2009 | -- | $133,009 +2% |
| 2008 | -- | $130,402 +2% |
| 2007 | -- | $127,846 +2% |
| 2006 | -- | $125,340 +2% |
| 2005 | -- | $122,884 +2% |
| 2004 | -- | $120,476 +1.9% |
| 2003 | -- | $118,269 +2% |
| 2002 | -- | $115,951 +2% |
| 2001 | -- | $113,679 |
Find assessor info on the county website
Monthly payment
Est. payment
Payment breakdown
Explore the cost of this home by adjusting the details. Changes won't be saved.Climate risks
Neighborhood: North Valley
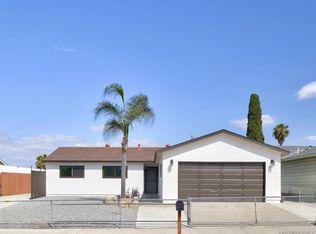


Similar homes
- $740,0003 bd2 ba1k sqft716 Rena Dr, Oceanside, CA 92057For Sale
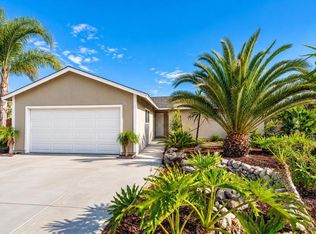 MLS ID #PTP2607682, Tino Velazquez, Real Broker. CRMLS
- $750,0004 bd2 ba1.2k sqft656 Flora Dr, Oceanside, CA 92057For Sale
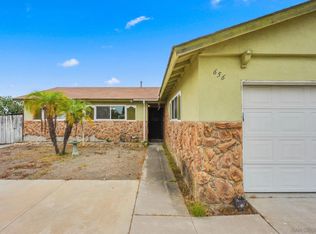 MLS ID #260024246, Vicente B Enriquez, Keller Williams San Diego Metro. SDMLS
- $799,9003 bd2 ba1k sqft630 Ann St, Oceanside, CA 92057For Sale
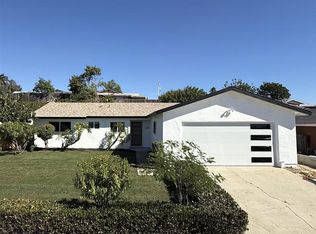 MLS ID #PTP2607772, Ray Fraser, Real Broker. CRMLS
- $779,0004 bd2 ba1.1k sqft652 Parker St, Oceanside, CA 92057For Sale
 MLS ID #OC26217979, Abby Cline, Anvil Real Estate. CRMLS
Local buyer's agents are ready to help
