Rare turnkey 2-unit residential investment property fully occupied with established, long-term tenants who would love to stay. 1,738 total sq ft. Ideal buy-and-hold add to any Toledo portfolio. Seller pays $100/month on average for city water. Tenants pay remiander of utilities. Tenants are MTM at $500 and $600 per month. Sold as-is. Situated in a convenient Toledo location close to local transit, major routes, and everyday amenities. Curb offer or show-by-appointment options are available to respect current tenant privacy.
Active
$84,900
678 Thomas St, Toledo, OH 43609
4beds
1,494sqft
Duplex, Multi Family
Built in 1907
-- sqft lot
$-- Zestimate®
$57/sqft
$-- HOA
What's special
- 40 days
- 395
- 32
Zillow last checked:
Listing updated:
Listed by:
James Haddox 330-573-3569 haddoxrealty@gmail.com,
Richfield Realty Group LLC
Source: MLS Now,MLS#: 5243045 Originating MLS: Medina County Board of REALTORS
Facts & features
Interior
Bedrooms & bathrooms
- Bedrooms: 4
- Bathrooms: 2
- Full bathrooms: 2
Heating
- Forced Air, Gas
Cooling
- None
Features
- Basement: Crawl Space,Dirt Floor,Unfinished
Interior area
- Total structure area: 1,494
- Total interior livable area: 1,494 sqft
- Finished area above ground: 1,494
Video & virtual tour
Property
Parking
- Parking features: Driveway
Features
- Levels: Two
- Stories: 2
Lot
- Size: 3,497 Square Feet
Details
- Parcel number: 0450311
Construction
Type & style
- Home type: MultiFamily
- Property subtype: Duplex, Multi Family
Materials
- Vinyl Siding
- Roof: Asphalt,Fiberglass
Condition
- Year built: 1907
Utilities & green energy
- Sewer: Public Sewer
- Water: Public
Community & HOA
Community
- Subdivision: Earls 2nd Add
Location
- Region: Toledo
Financial & listing details
- Price per square foot: $57/sqft
- Tax assessed value: $37,300
- Annual tax amount: $922
- Date on market: 9/11/2026
- Cumulative days on market: 41 days
- Listing terms: Cash,Conventional
Estimated market value
Not available
Estimated sales range
Not available
Not available
Price history
| Date | Event | Price |
|---|---|---|
| 9/11/2026 | Listed for sale | $84,900+97.4%$57/sqft |
Source:  MLS Now #5243045 Report a problem | ||
| 6/24/2022 | Sold | $43,000+72%$29/sqft |
Source: Public Record Report a problem | ||
| 10/30/2020 | Sold | $25,000-26.3%$17/sqft |
Source: NORIS #6060872 Report a problem | ||
| 10/6/2020 | Pending sale | $33,900$23/sqft |
Source: RE/MAX Preferred Associates #6060872 Report a problem | ||
| 10/5/2020 | Listed for sale | $33,900$23/sqft |
Source: RE/MAX Preferred Associates #6060872 Report a problem | ||
Public tax history
| Year | Property taxes | Tax assessment |
|---|---|---|
| 2025 | $922 +2.9% | $13,055 |
| 2024 | $896 +41.7% | $13,055 +58.7% |
| 2023 | $632 0% | $8,225 |
| 2022 | $632 -0.7% | $8,225 |
| 2021 | $637 -5% | $8,225 +7.3% |
| 2020 | $670 +1% | $7,665 |
| 2019 | $663 +1.3% | $7,665 |
| 2018 | $655 -6.1% | $7,665 |
| 2017 | $697 +1.6% | $7,665 -65% |
| 2016 | $686 +1.5% | $21,900 |
| 2015 | $676 +36.4% | $21,900 +185.5% |
| 2014 | $496 | $7,670 |
| 2013 | $496 +4.1% | $7,670 |
| 2012 | $476 +1.1% | $7,670 +15.2% |
| 2011 | $471 +2.6% | $6,660 |
| 2010 | $459 -4.3% | $6,660 |
| 2009 | $480 -21.7% | $6,660 -31.3% |
| 2008 | $612 +3% | $9,700 |
| 2007 | $594 +3.6% | $9,700 |
| 2006 | $574 +3% | $9,700 -14.2% |
| 2004 | $557 -0.3% | $11,310 |
| 2003 | $559 -10.2% | $11,310 +16.1% |
| 2002 | $622 +28.6% | $9,740 |
| 2001 | $484 -43.4% | $9,740 |
| 2000 | $854 | $9,740 |
Find assessor info on the county website
Monthly payment
Est. payment
Payment breakdown
Explore the cost of this home by adjusting the details. Changes won't be saved.Climate risks
Neighborhood: South Side
Nearby schools

Similar homes
- $85,0004 bd1 ba1.3k sqft2335 Ward St, Toledo, OH 43609For Sale
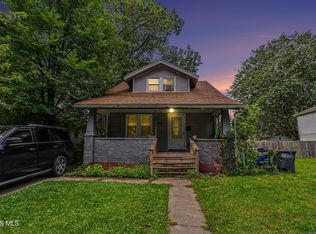 MLS ID #10014945, Justin D Annis, RE/MAX Preferred Associates. NORIS
- $85,0005 bd2 ba1.6k sqft733 Redwood Ave, Toledo, OH 43609For Sale
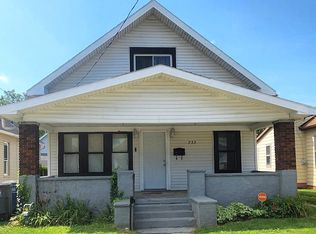 MLS ID #10012051, Crystal Zattau, Key Realty. NORIS
- $74,9004 bd2 ba1.6k sqft3104 Franklin Ave, Toledo, OH 43608For Sale
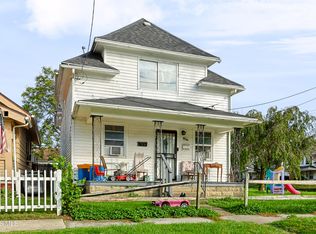 MLS ID #10014564, Austin James Cleghorn, LPG Realty. NORIS
- $60,0004 bd1 ba1.1k sqft1050 Harding Dr, Toledo, OH 43609For Sale
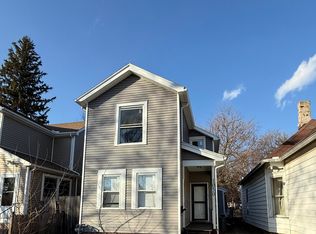 MLS ID #10014809, Marcus Hammer, Key Realty LTD. NORIS
