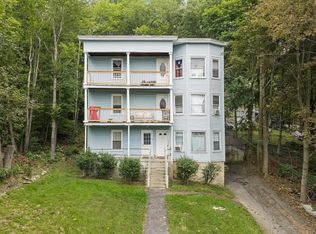
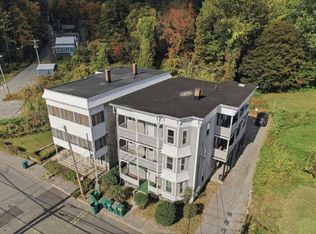
Welcome to 70 Prichard St, a spacious 2-family home offering an excellent opportunity for both owner-occupants and investors. Unit 1 features 2 bedrooms, while the larger Unit 2 offers 4 bedrooms, providing flexible living arrangements and strong rental potential. With 6 total bedrooms across two separate units, this property is well suited for multi-generational living, rental income, or buyers looking to offset their mortgage with additional income. Conveniently located near shopping, restaurants, schools, public transportation, and major routes, this property offers easy access to everything Fitchburg has to offer. A great opportunity to own a multi-family property with plenty of space and potential. HUGE Opportunity for Owner Occupied or Investor! Schedule your showing today!
For sale
Price cut: $5K (10/17)
$640,000
70 Prichard St, Fitchburg, MA 01420
6beds
3,016sqft
2 Family - 2 Units Up/Down
Built in 1900
-- sqft lot
$632,900 Zestimate®
$212/sqft
$-- HOA
What's special
- 29 days
- 337
- 22
Zillow last checked:
Listing updated:
Listed by:
Dick Lee 508-277-9939,
eXp Realty LLC - Corporate Office 888-854-7493
Source: MLS PIN,MLS#: 73580715
Facts & features
Interior
Bedrooms & bathrooms
- Bedrooms: 6
- Bathrooms: 2
- Full bathrooms: 2
Features
- Flooring: Laminate, Hardwood
- Basement: Unfinished
- Has fireplace: No
Interior area
- Total structure area: 3,016
- Total interior livable area: 3,016 sqft
- Finished area above ground: 3,016
Property
Parking
- Parking features: On Street
- Has uncovered spaces: Yes
Features
- Patio & porch: Porch, Patio
- Has view: Yes
- View description: City View(s)
Lot
- Size: 5,824 Square Feet
- Features: Sloped
Details
- Parcel number: M:0043 B:0016 L:0000,1503815
- Zoning: RC
Construction
Type & style
- Home type: MultiFamily
- Property subtype: 2 Family - 2 Units Up/Down
Materials
- Frame
- Foundation: Stone
- Roof: Shingle
Condition
- Year built: 1900
Utilities & green energy
- Electric: Circuit Breakers, Individually Metered
- Sewer: Public Sewer
- Water: Public
- Utilities for property: for Gas Range
Community & HOA
Community
- Features: Public Transportation, Shopping, T-Station, University
Location
- Region: Fitchburg
Financial & listing details
- Price per square foot: $212/sqft
- Tax assessed value: $547,100
- Annual tax amount: $7,271
- Date on market: 9/22/2026
- Listing terms: Contract
- Total actual rent: 5050
Estimated market value
$632,900
$601,000 - $665,000
$2,110/mo
Price history
| Date | Event | Price |
|---|---|---|
| 10/17/2026 | Price change | $640,000-0.8%$212/sqft |
Source: MLS PIN #73580715 Report a problem | ||
| 9/22/2026 | Listed for sale | $645,000+4.9%$214/sqft |
Source: MLS PIN #73580715 Report a problem | ||
| 5/16/2025 | Sold | $615,000-1.6%$204/sqft |
Source: MLS PIN #73319290 Report a problem | ||
| 3/20/2025 | Price change | $625,000-2.1%$207/sqft |
Source: MLS PIN #73319290 Report a problem | ||
| 2/2/2025 | Price change | $638,500-1.5%$212/sqft |
Source: MLS PIN #73319290 Report a problem | ||
| 1/7/2025 | Price change | $648,000-0.3%$215/sqft |
Source: MLS PIN #73319290 Report a problem | ||
| 12/12/2024 | Listed for sale | $650,000+16.1%$216/sqft |
Source: MLS PIN #73319290 Report a problem | ||
| 4/12/2024 | Sold | $560,000+13.2%$186/sqft |
Source: MLS PIN #73208752 Report a problem | ||
| 3/13/2024 | Contingent | $494,900$164/sqft |
Source: MLS PIN #73208752 Report a problem | ||
| 3/5/2024 | Listed for sale | $494,900+766%$164/sqft |
Source: MLS PIN #73208752 Report a problem | ||
| 5/25/2011 | Sold | $57,150+0.3%$19/sqft |
Source: Public Record Report a problem | ||
| 4/15/2011 | Listed for sale | $57,000-16.1%$19/sqft |
Source: Alpha Real Estate #71089025 Report a problem | ||
| 9/2/2010 | Listing removed | $67,900$23/sqft |
Source: Rosemary Richard #71089025 Report a problem | ||
| 6/3/2010 | Listed for sale | $67,900-65.6%$23/sqft |
Source: Rosemary Richard #71089025 Report a problem | ||
| 1/16/2004 | Sold | $197,500+696.4%$65/sqft |
Source: Public Record Report a problem | ||
| 8/4/1997 | Sold | $24,800-69%$8/sqft |
Source: Public Record Report a problem | ||
| 9/30/1991 | Sold | $79,900$26/sqft |
Source: Public Record Report a problem | ||
Public tax history
| Year | Property taxes | Tax assessment |
|---|---|---|
| 2025 | $6,592 +41.3% | $487,900 +54.9% |
| 2024 | $4,664 +8.9% | $314,900 +17.8% |
| 2023 | $4,284 +6.9% | $267,400 +17.5% |
| 2022 | $4,008 +0.6% | $227,600 +8.7% |
| 2021 | $3,985 +4.6% | $209,400 +8.3% |
| 2020 | $3,810 +17.5% | $193,300 +22.2% |
| 2019 | $3,242 +13.5% | $158,200 +16.3% |
| 2018 | $2,857 +10.3% | $136,000 +12.9% |
| 2017 | $2,590 +12.7% | $120,500 +11.3% |
| 2016 | $2,299 -0.6% | $108,300 -3.2% |
| 2015 | $2,314 +7% | $111,900 +2.6% |
| 2014 | $2,163 +3% | $109,100 -1% |
| 2013 | $2,099 +1.4% | $110,200 -6.1% |
| 2012 | $2,069 -2.7% | $117,400 -10.6% |
| 2011 | $2,127 -14.2% | $131,300 -32.7% |
| 2009 | $2,478 +4.6% | $195,100 -3.2% |
| 2008 | $2,368 +5.2% | $201,500 +3.3% |
| 2007 | $2,250 +5.3% | $195,000 +10% |
| 2006 | $2,137 +8.8% | $177,200 +15.9% |
| 2005 | $1,965 +44.6% | $152,900 +55.5% |
| 2004 | $1,359 +0.8% | $98,300 +14.8% |
| 2003 | $1,348 +13.4% | $85,600 +28.3% |
| 2001 | $1,189 -4.7% | $66,700 -2.6% |
| 2000 | $1,247 +0.1% | $68,500 -17.1% |
| 1996 | $1,246 | $82,600 |
Find assessor info on the county website
Monthly payment
Est. payment
Payment breakdown
Explore the cost of this home by adjusting the details. Changes won't be saved.Climate risks
Neighborhood: 01420


Similar homes
- $629,9998 bd2 ba4.3k sqft61 Congress St, Fitchburg, MA 01420For Sale
 MLS ID #73587349, MG Group, Century 21 North East. MLS PIN
- $589,9006 bd3 ba3.1k sqft11 Nutting St, Fitchburg, MA 01420For Sale
 MLS ID #73576281, Nicholas L. Pelletier, Keller Williams Realty North Central. MLS PIN
- $629,9005 bd3 ba2.6k sqft26 Caswell St, Fitchburg, MA 01420For Sale
 MLS ID #73580063, Matthew Straight, Coldwell Banker Realty - Leominster. MLS PIN
- $650,0009 bd3 ba3.7k sqft50 West St, Fitchburg, MA 01420For Sale
 MLS ID #73590884, Lidiya Dimova, Lamacchia Realty, Inc.. MLS PIN
