CASH ONLY!!!! FINANACING IS NOT POSSIBLE FOR THIS MANUFACTURED HOME* WILL MAKE AN AMAZING HOME OR RENTAL***This home has new paint, new carpet, new tile, new kitchen cabinets, new appliances, new lighting, new doors, and has a working fireplace. Kitchen with separate dinning area, has a family room down stairs. Comes with washer and dyer hookup. Partially fenced in yard and a garage.
Pre-foreclosure
Est. $435,600
7326 S 2700 W, West Jordan, UT 84084
4beds
1,824sqft
SingleFamily
Built in 1973
9,583 Square Feet Lot
$435,600 Zestimate®
$239/sqft
$-- HOA
Overview
- 272 days
- 4
- 1
Facts & features
Interior
Bedrooms & bathrooms
- Bedrooms: 4
- Bathrooms: 1
- Full bathrooms: 1
Heating
- Other
Cooling
- None
Features
- Basement: Finished
- Has fireplace: Yes
Interior area
- Total interior livable area: 1,824 sqft
Property
Parking
- Total spaces: 2
- Parking features: Garage - Attached
Features
- Exterior features: Other
Lot
- Size: 9,583 Square Feet
Details
- Parcel number: 21281770420000
- Zoning: Single-Family
Construction
Type & style
- Home type: SingleFamily
Materials
- Other
- Roof: Asphalt
Condition
- Year built: 1973
Utilities & green energy
- Utilities for property: Power: Connected, Water: Connected, Gas: Connected, Sewer: Connected, Sewer: Public
Community & HOA
Location
- Region: West Jordan
Financial & listing details
- Price per square foot: $239/sqft
- Tax assessed value: $328,600
- Annual tax amount: $1,627
Foreclosure details
Estimated market value
$435,600
$414,000 - $457,000
$2,162/mo
Price history
| Date | Event | Price |
|---|---|---|
| 5/20/2021 | Listing removed | -- |
Source:  RE/MAX International Report a problem | ||
| 4/10/2021 | Pending sale | $250,000$137/sqft |
Source:  UtahRealEstate.com #1714344 Report a problem | ||
| 4/5/2021 | Listed for sale | $250,000$137/sqft |
Source: UtahRealEstate.com #1714344 Report a problem | ||
| 2/26/2021 | Pending sale | $250,000$137/sqft |
Source: RE/MAX International #1714344 Report a problem | ||
| 2/26/2021 | Listed for sale | $250,000$137/sqft |
Source: RE/MAX Associates #1714344 Report a problem | ||
| 2/26/2021 | Pending sale | $250,000$137/sqft |
Source: UtahRealEstate.com #1714344 Report a problem | ||
| 2/24/2021 | Price change | $250,000+4.2%$137/sqft |
Source: UtahRealEstate.com #1714344 Report a problem | ||
| 12/30/2020 | Pending sale | $240,000$132/sqft |
Source: UtahRealEstate.com #1714344 Report a problem | ||
| 12/28/2020 | Listed for sale | $240,000$132/sqft |
Source: Local MLS #1714344 Report a problem | ||
| 11/28/2020 | Pending sale | $240,000$132/sqft |
Source: RE/MAX Associates #1714344 Report a problem | ||
| 11/25/2020 | Listed for sale | $240,000-11.1%$132/sqft |
Source: RE/MAX Associates Layton #1714344 Report a problem | ||
| 3/1/2019 | Listing removed | $1,550$1/sqft |
Source: BMPM Report a problem | ||
| 2/13/2019 | Listed for rent | $1,550+3.3%$1/sqft |
Source: BMPM Report a problem | ||
| 2/13/2019 | Listing removed | $269,900$148/sqft |
Source: BlueMountain Realty #1549685 Report a problem | ||
| 2/12/2019 | Price change | $269,900+8%$148/sqft |
Source: BlueMountain Realty #1549685 Report a problem | ||
| 11/30/2018 | Price change | $249,900-5.7%$137/sqft |
Source: BlueMountain Realty #1549685 Report a problem | ||
| 10/5/2018 | Price change | $264,900-3.6%$145/sqft |
Source: BlueMountain Realty #1549685 Report a problem | ||
| 8/23/2018 | Listed for sale | $274,900$151/sqft |
Source: BlueMountain Realty #1549685 Report a problem | ||
| 1/31/2018 | Listing removed | $1,500$1/sqft |
Source: BMPM Report a problem | ||
| 1/30/2018 | Listed for rent | $1,500$1/sqft |
Source: BMPM Report a problem | ||
Public tax history
| Year | Property taxes | Tax assessment |
|---|---|---|
| 2025 | $1,627 -15% | $180,730 -10.7% |
| 2024 | $1,913 +28.3% | $202,455 +36.2% |
| 2023 | $1,491 -1.4% | $148,665 +0.3% |
| 2022 | $1,511 | $148,280 +59.8% |
| 2021 | -- | $92,785 -3.2% |
| 2020 | $1,144 +11.3% | $95,865 +13.5% |
| 2019 | $1,028 +3.3% | $84,480 +4.6% |
| 2018 | $995 +0.4% | $80,795 -46.9% |
| 2017 | $991 -3.8% | $152,100 -7.3% |
| 2016 | $1,031 -12.9% | $164,000 +4.4% |
| 2015 | $1,183 +1.8% | $157,100 +13.8% |
| 2014 | $1,162 | $138,000 +5.6% |
| 2013 | -- | $130,700 +3.8% |
| 2012 | -- | $125,900 -16.2% |
| 2011 | -- | $150,300 -8.3% |
| 2010 | -- | $163,900 -0.9% |
| 2009 | -- | $165,400 -13.5% |
| 2008 | $1,166 | $191,300 +5.3% |
| 2007 | -- | $181,600 +30.1% |
| 2006 | -- | $139,600 +8.9% |
| 2005 | -- | $128,200 +7.5% |
| 2002 | -- | $119,300 +8.8% |
| 2001 | -- | $109,700 +9.5% |
| 2000 | -- | $100,200 |
Find assessor info on the county website
Monthly payment
Climate risks
Neighborhood: 84084
Nearby schools
Schools provided by the listing agent
- Elementary: Westland
- Middle: West Jordan
- High: West Jordan
- District: Jordan
Source: The MLS. This data may not be complete. We recommend contacting the local school district to confirm school assignments for this home.

Similar homes
- $475,0004 bd2 ba1.9k sqft3850 W Owensboro Dr, West Jordan, UT 84084For Sale
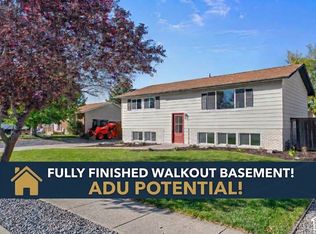
 MLS ID #2192119, Jeff Hutchings, Utah's Properties LLC. UtahRealEstate.com
- $450,0005 bd2 ba2k sqft7684 S 2250 W, West Jordan, UT 84084For Sale
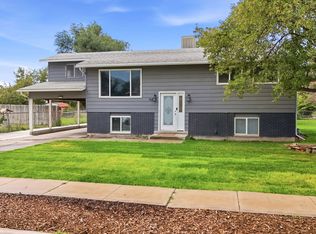 MLS ID #2185939, Darin Thomas, Real Broker, LLC. UtahRealEstate.com
- $569,9005 bd2 ba2.3k sqft7297 S 2700 W, West Jordan, UT 84084For Sale
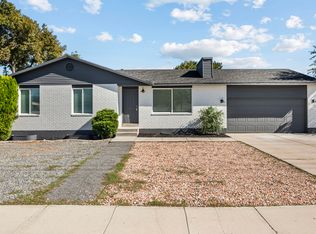 MLS ID #2191744, Jaime Calderon, Real Team Realty LLC. UtahRealEstate.com
- $470,0004 bd2 ba2k sqft6986 S Lexington Dr, West Jordan, UT 84084For Sale
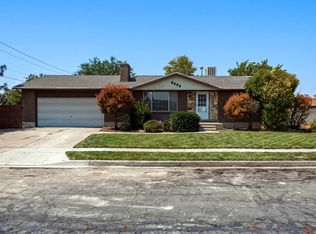 MLS ID #2180060, Collin Hopkins, Keyrenter Real Estate. UtahRealEstate.com
- $469,4004 bd2 ba1.8k sqft7208 S Christalee Ct, West Jordan, UT 84084For SaleMLS ID #2190549, Karina Bassett, Fathom Realty (Union Park). UtahRealEstate.com
- $465,0004 bd2 ba1.7k sqft6498 S Scranton Dr, West Jordan, UT 84084For SaleMLS ID #2190084, Scott Hardey, Hardey Realty Group. UtahRealEstate.com
- $625,0004 bd3 ba2.6k sqft2582 W Jean Way, West Jordan, UT 84084For SaleMLS ID #2191789, Zachary Bellows, Realtypath LLC (South Valley). UtahRealEstate.com
- $490,0005 bd2 ba1.8k sqft2234 W 7680 S, West Jordan, UT 84084For SaleMLS ID #2181533, Samantha Wilkinson, SURV REAL ESTATE INC. UtahRealEstate.com
- $559,9005 bd3 ba2.5k sqft3353 W Porter Cir, West Jordan, UT 84084For SaleMLS ID #2191783, Nelson Pesantes, Equity Real Estate (Solid). UtahRealEstate.com
- $449,9005 bd2 ba1.5k sqft7690 S 1530 W, West Jordan, UT 84084For SaleMLS ID #2183739, Casey Hansen, Windermere Real Estate (Daybreak). UtahRealEstate.com
- $449,9004 bd2 ba1.6k sqft6695 S Somerset Dr, West Jordan, UT 84084For SaleMLS ID #2143925, Yesenia Gonzalez, Signature Group Real Estate. UtahRealEstate.com
- $495,0004 bd3 ba2k sqft6859 S 2200 W, West Jordan, UT 84084For SaleMLS ID #2181761, Ashley McClelland, Real Estate Essentials. UtahRealEstate.com
- $560,0004 bd2 ba1.8k sqft7282 S 2700 W, West Jordan, UT 84084For SaleMLS ID #2173168, Carl Gunter, Equity Real Estate (Buckley). UtahRealEstate.com
- $514,9994 bd2 ba1.9k sqft7551 S 2230 W, West Jordan, UT 84084For SaleMLS ID #2187766, Annie Le, Presidio Real Estate (South Valley). UtahRealEstate.com
- $500,0004 bd2 ba1.8k sqft6764 S 3370 W, West Jordan, UT 84084For SaleMLS ID #2188821, Carolee Mecham, Cannon & Company. UtahRealEstate.com
- $499,5504 bd2 ba1.9k sqft2141 W 7125 S, West Jordan, UT 84084For SaleMLS ID #2162253, Mark W. Feigh, Cannon & Company. UtahRealEstate.com
- $460,0003 bd2 ba1.7k sqft7588 S Jordan Dale Rd, West Jordan, UT 84084For SaleMLS ID #2143282, Lilian Lobos, Century 21 Everest (Centerville). UtahRealEstate.com
- $649,0004 bd2 ba2.1k sqft2810 W 7268 S, West Jordan, UT 84084For SaleMLS ID #2181276, Maritta Dalrymple, KW Utah Realtors Keller Williams (Brickyard). UtahRealEstate.com
- $490,0004 bd2 ba1.9k sqft1532 W Marty Cir, West Jordan, UT 84084For SaleMLS ID #2189272, Tatyana Korotayeva, Selling Salt Lake. UtahRealEstate.com
- $517,9004 bd2 ba2k sqft2079 W Arthur Dr S, West Jordan, UT 84084For SaleMLS ID #2171862, Curtis J. Brown, Equity Real Estate. UtahRealEstate.com
