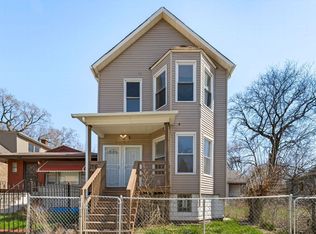
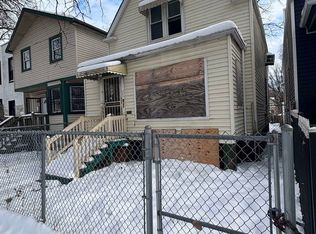
When opportunity knocks!!! Open your wallet!!! great opportunity in Englewood! Tremendous up side on this 3 BR 1 Bath.Home sitting on a double lot (50x125) in need of a full rehab!!!! 2 blocks away from the busy Halsted St corridor. 5 minutes drive from 90/94 making it 20 Mnts away from downtown Chicago or Indiana border for some cheap gas!!! Property sold as is cash or a strong rehab loan. NO SURVEY PROVIDED BY SELLER. BUYER RESPONSIBLE FOR INSPECTIONS, COMPLIANCE, LIENS & ESCROWS AS NEEDED BUYER RESPONSIBLE FOR DOING THEIR DUE DILIGENCE ASSESSING THIS PROPERTY Property has an active DEMO court.
Price change
Price cut: $1K (6/25)
$68,000
7331 S Peoria St, Chicago, IL 60621
3beds
1,200sqft
Single Family Residence
Built in 1890
6,250 Square Feet Lot
$-- Zestimate®
$57/sqft
$-- HOA
What's special
- 22 days |
- 447 |
- 26 |
Zillow last checked:
Listing updated:
Listed by:
Rene Mendoza 312-600-7595,
Chicagoland Brokers, Inc.
Source: MRED as distributed by MLS GRID,MLS#: 12669812
Loading...
Facts & features
Interior
Bedrooms & bathrooms
- Bedrooms: 3
- Bathrooms: 1
- Full bathrooms: 1
Rooms
- Room types: No additional rooms
Primary bedroom
- Level: Main
- Area: 135 Square Feet
- Dimensions: 15X9
Bedroom 2
- Level: Main
- Area: 100 Square Feet
- Dimensions: 10X10
Bedroom 3
- Level: Main
- Area: 112 Square Feet
- Dimensions: 16X7
Dining room
- Level: Main
- Area: 91 Square Feet
- Dimensions: 13X7
Kitchen
- Level: Main
- Area: 110 Square Feet
- Dimensions: 11X10
Living room
- Level: Main
- Area: 180 Square Feet
- Dimensions: 18X10
Heating
- Natural Gas
Cooling
- None
Features
- Basement: Unfinished,Full
Interior area
- Total structure area: 0
- Total interior livable area: 1,200 sqft
Property
Accessibility
- Accessibility features: No Disability Access
Features
- Stories: 1
Lot
- Size: 6,250 Square Feet
- Dimensions: 50X125
Details
- Parcel number: 20292220120000
- Special conditions: None
Construction
Type & style
- Home type: SingleFamily
- Property subtype: Single Family Residence
Materials
- Frame
Condition
- New construction: No
- Year built: 1890
Utilities & green energy
- Sewer: Public Sewer
- Water: Public
Community & HOA
HOA
- Services included: None
Location
- Region: Chicago
Financial & listing details
- Price per square foot: $57/sqft
- Tax assessed value: $39,000
- Annual tax amount: $632
- Date on market: 6/5/2026
- Ownership: Fee Simple
Estimated market value
Not available
Estimated sales range
Not available
$1,696/mo
Price history
| Date | Event | Price |
|---|---|---|
| 6/25/2026 | Price change | $68,000-1.4%$57/sqft |
Source: | ||
| 6/5/2026 | Listed for sale | $69,000-8%$58/sqft |
Source: | ||
| 5/14/2026 | Listing removed | $75,000$63/sqft |
Source: | ||
| 5/8/2026 | Listed for sale | $75,000+114.9%$63/sqft |
Source: | ||
| 1/29/2025 | Listing removed | $34,900$29/sqft |
Source: | ||
| 1/15/2025 | Listed for sale | $34,900-69.7%$29/sqft |
Source: | ||
| 5/29/2012 | Listing removed | $115,000$96/sqft |
Source: Exit Real Estate Partners - Downers Grove #07827124 Report a problem | ||
| 7/9/2011 | Listing removed | $1,100$1/sqft |
Source: NGBR INC. Report a problem | ||
| 6/9/2011 | Listed for sale | $115,000+1252.9%$96/sqft |
Source: EXIT Real Estate Partners #07827124 Report a problem | ||
| 4/16/2011 | Listed for rent | $1,100$1/sqft |
Source: NGBR INC. Report a problem | ||
| 3/5/2011 | Listing removed | $1,100$1/sqft |
Source: NGBR INC. Report a problem | ||
| 1/15/2011 | Listed for rent | $1,100$1/sqft |
Source: NGBR INC. Report a problem | ||
| 4/28/2009 | Sold | $8,500-43%$7/sqft |
Source: | ||
| 1/5/2009 | Listing removed | $14,900$12/sqft |
Source: foreclosure.com Report a problem | ||
| 12/31/2008 | Listed for sale | $14,900-87.8%$12/sqft |
Source: foreclosure.com Report a problem | ||
| 5/10/2005 | Sold | $122,000+74.3%$102/sqft |
Source: Public Record Report a problem | ||
| 2/25/2005 | Sold | $70,000-41.7%$58/sqft |
Source: Public Record Report a problem | ||
| 4/2/2004 | Sold | $120,000+207.7%$100/sqft |
Source: Public Record Report a problem | ||
| 10/28/2003 | Sold | $39,000+116.7%$33/sqft |
Source: Public Record Report a problem | ||
| 3/4/2003 | Sold | $18,000-69%$15/sqft |
Source: Public Record Report a problem | ||
| 10/26/1998 | Sold | $58,000$48/sqft |
Source: Public Record Report a problem | ||
Public tax history
| Year | Property taxes | Tax assessment |
|---|---|---|
| 2024 | -- | $3,900 +30.1% |
| 2023 | $633 +2.6% | $2,998 |
| 2022 | $617 +2.3% | $2,998 |
| 2021 | $603 -54.1% | $2,998 -49.1% |
| 2020 | $1,313 -0.2% | $5,895 -10% |
| 2019 | $1,316 +1.7% | $6,550 |
| 2018 | $1,294 -21.5% | $6,550 -14.4% |
| 2017 | $1,648 +7.5% | $7,656 |
| 2016 | $1,533 +89.3% | $7,656 +73.2% |
| 2015 | $810 -41.6% | $4,421 -40.9% |
| 2014 | $1,388 +2% | $7,482 |
| 2013 | $1,361 +1.4% | $7,482 |
| 2012 | $1,343 -22% | $7,482 -29.6% |
| 2011 | $1,721 -0.4% | $10,621 |
| 2010 | $1,728 +4.4% | $10,621 |
| 2009 | $1,656 +2.4% | $10,621 -5.8% |
| 2008 | $1,617 +1% | $11,272 |
| 2007 | $1,601 -1.1% | $11,272 |
| 2006 | $1,618 +37.9% | $11,272 +57% |
| 2005 | $1,173 +1% | $7,181 |
| 2004 | $1,162 +2.2% | $7,181 |
| 2003 | $1,136 +25.4% | $7,181 +42.3% |
| 2002 | $906 +3.7% | $5,045 |
| 2001 | $874 +14.7% | $5,045 |
| 2000 | $762 -0.7% | $5,045 +27.3% |
| 1999 | $767 | $3,964 |
Find assessor info on the county website
Monthly payment
Est. payment$--/mo
Payment breakdown
Explore the cost of this home by adjusting the details. Changes won't be saved.All calculations are estimates and provided by Zillow, Inc. for informational purposes only. Actual amounts may vary.
HOA fees may include property taxes on listings classified as Co-Ops. Contact the listing agent and/or owner for fee details.
Mortgage interest rates are dependent on a number of factors, including credit score, down payment, and repayment length. Interest rate data provided by Zillow Group Marketplace, Inc. as of 1/1/1970 from various mortgage lenders with which we have lead or other similar arrangements; the Estimated Payment is an average of those rates.
See how much you could borrow to make a competitive offer.
Climate risks
Neighborhood: Englewood
Nearby schools
GreatSchools rating
- 4/10Stagg Elementary SchoolGrades: PK-8Distance: 0.2 mi
- 1/10Hirsch Metropolitan High SchoolGrades: 9-12Distance: 2.3 mi
Schools provided by the listing agent
- District: 299
Source: MRED as distributed by MLS GRID. This data may not be complete. We recommend contacting the local school district to confirm school assignments for this home.
A local agent can set up tours, give advice and negotiate with sellers.


- Illinois
- Cook County
- Chicago
- 60621
- Englewood
- 7331 S Peoria St
Nearby cities
Nearby neighborhoods
Nearby zip codes
Other Chicago Topics
