This beautiful spacious 2-flat brick property for sale in Greater Grand Crossing offering an excellent opportunity for real estate investors, owner-occupants and buyers searching for a Chicago multi-family property with rental income potential. The first unit offers two bedrooms and one bathroom plus a basement that duplex down with additional room for more space with a washer and dryer. The second-floor unit features three bedrooms and one bathroom. The roof, hot water tank and furnace are approximately 5 years old. Rehab work was completed in 2021 and tuck point in 2026. There is a spacious backyard with a rear concrete pad for two car parking. Both units are occupied and leased for 1550 providing immediate rental income and room for increase.
Active
$330,000
7430 S Evans Ave, Chicago, IL 60619
5beds
--sqft
Multi Family
Built in 1905
-- sqft lot
$326,300 Zestimate®
$--/sqft
$-- HOA
What's special
Spacious backyard
- 13 days
- 170
- 13
Zillow last checked:
Listing updated:
Listed by:
Tatiana Reed 312-244-5511,
Keller Williams ONEChicago
Source: MRED as distributed by MLS GRID,MLS#: 12778999
Facts & features
Interior
Bedrooms & bathrooms
- Bedrooms: 5
- Bathrooms: 2
- Full bathrooms: 2
Heating
- Natural Gas, Electric
Features
- Basement: Unfinished,Full
Property
Parking
- Total spaces: 2
- Parking features: Yes, Garage Owned, Detached, Garage
- Garage spaces: 2
Lot
- Size: 2,613 Square Feet
Details
- Parcel number: 20272300260000
- Special conditions: None
Construction
Type & style
- Home type: MultiFamily
- Property subtype: Multi Family
Materials
- Brick
- Foundation: Concrete Perimeter
Condition
- New construction: No
- Year built: 1905
- Major remodel year: 2022
Utilities & green energy
- Sewer: Public Sewer
- Water: Lake Michigan, Public
Community & HOA
Location
- Region: Chicago
Financial & listing details
- Tax assessed value: $179,000
- Annual tax amount: $3,730
- Date on market: 10/8/2026
- Ownership: Fee Simple
Estimated market value
$326,300
$310,000 - $343,000
$1,456/mo
Price history
| Date | Event | Price |
|---|---|---|
| 10/8/2026 | Listed for sale | $330,000+26.9% |
Source:  MRED as distributed by MLS GRID #12778999 Report a problem | ||
| 10/18/2023 | Listing removed | -- |
Source: MRED as distributed by MLS GRID #11698356 Report a problem | ||
| 2/21/2023 | Price change | $260,000-5.5% |
Source: MRED as distributed by MLS GRID #11698356 Report a problem | ||
| 1/10/2023 | Listed for sale | $275,000-8% |
Source: MRED as distributed by MLS GRID #11698356 Report a problem | ||
| 1/10/2023 | Listing removed | -- |
Source: MRED as distributed by MLS GRID #11664069 Report a problem | ||
| 10/31/2022 | Listed for sale | $299,000+367.2% |
Source: MRED as distributed by MLS GRID #11664069 Report a problem | ||
| 11/22/2019 | Sold | $64,000-5.2% |
Source: MRED as distributed by MLS GRID #10468876 Report a problem | ||
| 8/19/2019 | Pending sale | $67,500 |
Source: Exit Strategy Realty #10468876 Report a problem | ||
| 7/31/2019 | Listed for sale | $67,500 |
Source: Exit Strategy Realty #10468876 Report a problem | ||
Public tax history
| Year | Property taxes | Tax assessment |
|---|---|---|
| 2024 | $3,596 +70.4% | $17,900 +79% |
| 2023 | $2,110 +2.6% | $10,000 |
| 2022 | $2,057 +2.3% | $10,000 |
| 2021 | $2,011 -27.6% | $10,000 -19.8% |
| 2020 | $2,779 +28.7% | $12,475 -12% |
| 2019 | $2,159 +1.8% | $14,177 |
| 2018 | $2,122 -32% | $14,177 -20.6% |
| 2017 | $3,118 +1.3% | $17,861 |
| 2016 | $3,077 +10.2% | $17,861 |
| 2015 | $2,792 +52.3% | $17,861 +43.5% |
| 2014 | $1,833 -35.3% | $12,450 -20.1% |
| 2013 | $2,836 +117.1% | $15,591 |
| 2012 | $1,306 +6.8% | $15,591 -20.2% |
| 2011 | $1,223 +10.6% | $19,530 |
| 2010 | $1,106 -63.7% | $19,530 |
| 2009 | $3,045 +175.9% | $19,530 -14.2% |
| 2008 | $1,104 -42.9% | $22,751 |
| 2007 | $1,933 +35.1% | $22,751 |
| 2006 | $1,431 -5.1% | $22,751 +72.6% |
| 2005 | $1,509 +1.9% | $13,180 |
| 2004 | $1,480 +4.5% | $13,180 |
| 2003 | $1,417 +7.7% | $13,180 +29.7% |
| 2002 | $1,316 +8.4% | $10,163 |
| 2001 | $1,215 +51.3% | $10,163 |
| 2000 | $803 | $10,163 +39.4% |
| 1999 | $803 | $7,290 |
Find assessor info on the county website
Monthly payment
Est. payment
Payment breakdown
Explore the cost of this home by adjusting the details. Changes won't be saved.Climate risks
Neighborhood: Park Manor
Nearby schools
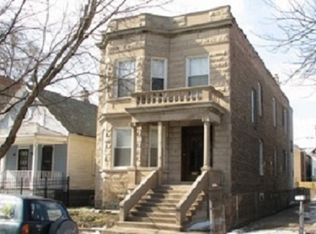
Similar homes
- $--6 bd2 ba2.9k sqft7209 S Michigan Ave, Chicago, IL 60619Auction
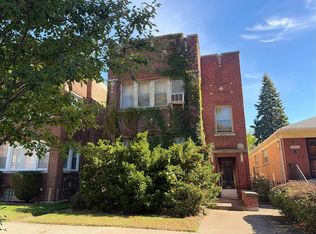 Auction.com 2
- $--5 bd2 ba2.3k sqft7248 S Champlain Ave, Chicago, IL 60619Auction
 ServiceLink Auction
- $--4 bd2 ba1.9k sqft7427 S Ingleside Ave, Chicago, IL 60619Auction
 Auction.com 1
- $300,0004 bd2 ba-- sqft8419 S Maryland Ave, Chicago, IL 60619Re-activated
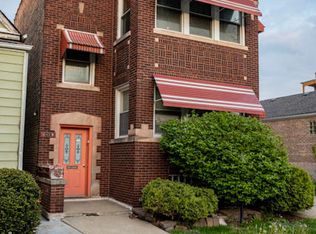 MLS ID #12697427, Turon Turner, Atlas Asset Management Realty LLC. MRED as distributed by MLS GRID
